Showing posts with label equity mutual funds. Show all posts

Saturday, 24 February 2024

SEBI Categorization and Rationalization of Mutual Funds - vrk100 - 24Feb2024

SEBI Categorization and Rationalization of Mutual Funds 


(This is for information purposes only. This should not be construed as a recommendation or investment advice even though the author is a CFA Charterholder. Please consult your financial adviser before taking any investment decision. Safe to assume the author has a vested interest in stocks / investments discussed if any.)


In October 2017, India's capital market regulator Securities and Exchange Board of India (SEBI) categorized mutual fund schemes into six categories, like, equity schemes, debt schemes, hybrid schemes and so on -- with a view to providing clear distinction and uniformity, in terms of asset allocation and investment strategy, to mutual fund plans.
 
SEBI's broad idea is investors, while assessing various mutual fund plans, should be able to properly understand the plans in terms of similarity of plans and uniformity of their characteristics.
 
 
1. Major Changes by SEBI
 
The major changes started in October 2017 by SEBI had several follow-up norms and further changes. The article looks at these changes and discusses the broad contours of these changes in the past six years or so.

As part of the changes, SEBI unwittingly was forced to introduce another new type of equity category, namely, Flexi Cap funds in November of 2020 -- which was a result of unsavoury changes made to Multi Cap funds in September of 2020. 
 
The author's real time views on 2020 multi cap fund changes were carried by Morningstar India, along with those of veteran fund managers, like, Sunil Singhania. 
 
 
(blog continues below)
 
------------------------------
 
Related blogs:
 
AMFI List of Market Cap: Categorization of Large-, Mid- and Small-Cap Stocks 

SEBI's New Regulation on Multi Cap Funds and Market Behaviour
 
------------------------------
 
 
2. Five Mutual Fund Groups
 
SEBI categorized all open-end mutual fund schemes into five broad groups. They are:
 
A. Equity schemes (11 schemes in total)
B. Debt schemes (16)
C. Hybrid schemes (6)
D. Solution-oriented Schemes (2)
E. Other schemes (2)
 
In case of equity schemes, mutual funds have to invest a certain percentage of stocks in the so-called large-, mid- and small-cap stocks as per the 'type of scheme,' as detailed in an earlier blog.

SEBI defined stocks based on their market capitalisation as follows:

1) large-cap stocks: 1st to 100th company in terms of full market capitalization

2) mid-cap stocks: 101st to 250th company in terms of full market capitalization

3) small-cap stocks: 251st company onwards in terms of full market capitalization
 
 
3. Equity schemes
 
The below table details equity fund categories, features of these categories and the percentage of stocks of total assets to be invested by each category. And it delineates what percentage of stocks to be invested in each category of stocks by market cap, namely, large-, mid- and small-cap stocks.

For example, a large cap fund has to invest at least 80 percent of total assets in large-cap stocks (as defined above). A large and mid cap fund has to invest at least 35 percent in large-cap stocks and 35 percent in the so-called mid-cap stocks. 

An ELSS plan is an equity linked savings scheme, which provides tax benefits but comes with a lock-in period of three years. It has to invest at least 80 percent of total assets in stocks.

On 11Sep2020, SEBI changed the asset allocation of Multi Cap funds and made it mandatory for them to invest at least 25% of total assets in each category of large-, mid- and small-cap stocks; and in total they have to invest at least 75 percent of total assets in equity and equity related instruments. 

A new equity mutual fund category, named Flexi Cap Fund, was introduced in November 2020 by SEBI in order to mollify mutual fund industry which was upset with the new SEBI norms on Multi Cap funds that were introduced on 11Sep2020 (only two days later SEBI was forced to issue a clarification to the Multi Cap category's new norms). 

Flexi Cap funds have the agility to move across stocks, irrespective of their market capitalisation -- giving a high degree of operational flexibility to fund managers.
 
Because of the operational flexibility inherent in Flexi Cap category, several mutual funds moved, between December 2020 and March 2021, their existing multi cap funds to flexi cap category en masse, as allowed by SEBI norms (see additional notes below).  
 
Please click on the image to view better >


4. Debt schemes
 
The below table details debt fund categories, features of these categories and what kind of debt and money market instruments are eligible for investment in each category. 
 
For example, a low duration fund has to invest in debt and money market instruments, with a portfolio Macaulay Duration of between six months and 12 months; while a dynamic bond fund can invest in debt instruments irrespective of the duration.
 
Please click on the image to view better > 
 
 
The following table provides features of the remaining debt schemes -- providing details of their features, the minimum investment they have to make in sovereign / corporate bonds and what percentage of total assets to invest.

For example, a credit risk fund has to invest at least 65 percent of total assets in AA and below rated corporate bonds (excluding AA+ rated bonds); while a gilt fund has to invest a minimum of 80 percent in sovereign bonds, namely, G-Secs or government securities.
 
Please click on the image to view better > 


5. Hybrid schemes
 
Hybrid schemes invest in a blend of asset classes, like, equity, debt, commodities like gold and silver, REITs or real estate investment trusts. 

For example, a conservative hybrid fund has to invest a minimum of between 75 and 90 percent in debt instruments and a minimum of between 10 and 25 percent in stocks.
 
Please click on the image to view better >


6. Solution-oriented and other schemes
 
Solution-oriented schemes are meant for a specific type of investors, like, retirees and children. Other schemes belong to index funds, exchange traded funds (ETFs) and Fund of Funds.
 
Please click on the image to view better >


7. Summary
 
One unintended consequence of SEBI's 2017 changes to categories of mutual funds is fund managers are forced to churn their portfolios more often in order to adhere to SEBI's norms on categorization and rationalization of mutual funds.

More churn or higher portfolio turnover means more profits for brokers, resulting in lower returns for unitholders of mutual funds. 

The 2017 categorization norms have taken away the freedom of money managers to manage the funds and the capital market regulator's back-seat driving has constrained the fund managers.
 
The original objectives of SEBI's categorization of schemes have, so far, not been realised. Asset management companies (AMCs) still are able to slice and dice the markets and indulge in launching a variety of mutual fund schemes as part of their asset gathering efforts.
 
As the number of equity MF category is limited to eleven only, the AMCs have been increasingly launching more and more schemes under the thematic / sectoral fund category.
 
During the period Apr2019 and Jan2024, number of thematic / sectoral funds rose from 91 to 150, with their assets rising by 337 percent to Rs 2.71 lakh crore as at the end of Jan2024 (see Additional Note 2 below).
 
Most of the investors still base their investment decisions (buying and selling of mutual funds) based on the past returns, chasing whatever hot fund/funds are the current flavour of the markets. 
 
The introduction of a new equity fund category, namely Flexi Cap funds in November 2020, provided another window for AMCs to gather more assets.  

The true colours of AMCs have not changed since the introduction of SEBI's norms on mutual fund categories, while the confusion for investors continues without any respite.

 
- - -
 
------------------------------
 
Additional Notes and Data:

1. Flexi Cap funds vs Multi Cap Funds:
 
The mindless Sep2020 SEBI regulation on Multi Cap / Flexi Cap funds achieved nothing. Between Dec2020 and Mar2021, 25 AMCs moved their multi cap funds to flexi cap funds (new equity MF category) as can be seen from the data in the table attached below.
 
Total assets of multi cap funds category dwindled precipitously from Rs 1.68 lakh crore at the end of Dec2020 to Rs 19,900 crore as of Mar2021, recording a fall of 88 percent. That AMCs shifted such huge amounts from one to another MF category is a big thumbs down to SEBI's clueless regulation.
 
Fund managers moved to flexi cap funds because they offer a higher degree of operational flexibility to them in terms of moving freely and dynamically, as per the market opportunities, among stocks irrespective of their market caps. 
 
On the other hand, money managers are constrained by SEBI's new regulation of Sep2020 on multi cap funds -- which mandated multi cap funds should invest at least 25 percent of their total assets in each category of large-, mid- and small-cap stocks.  

As can be seen from the data, between Mar2021 and Jan2024, number of schemes under multi cap increased from 10 to 24, whereas flexi cap schemes increased from 25 to 38 in the same period. 

AMCs are in the habit of asset gathering, and as such they often tend to introduce new plans in the process. That they again introduced, between Mar2021 and Jan2024, multi cap funds for gathering more assets and more fees is a different matter (it may be noted there are 43 AMCs now in India).


2.Equity schemes - How total assets and # of schemes changed:

AMFI started publishing mutual fund data in the current format (giving details as per Oct2017 SEBI norms on Categorization of MFs) effective from the month of  April 2019. So, from Apr2019 onwards, one could analyse how the assets and number of schemes increased among equity mutual funds.

As shown in the table below, between Apr2019 and Jan2024, number equity schemes increased from 307 to 427; whereas their total assets increased Rs 7.04 lakh crore to Rs 22.50 lakh crore, a rise of 220 percent, during the period. 

The biggest rise in number of schemes is from thematic / sectoral funds -- in less than five years, AMCs launched 59 new schemes. 

As the number of equity MF category is limited to eleven only, the AMCs have been increasingly launching more and more schemes under the thematic / sectoral fund category.
 
During the period Apr2019 and Jan2024, number of thematic / sectoral funds rose from 91 to 150, with their assets rising by 337 percent to Rs 2.71 lakh crore as at the end of Jan2024.
 
The biggest rise in total assets is from: Small Cap, Dividend Yield and Sectoral / Thematic fund categories. Small- and Mid-cap stocks have given spectacular returns in the past one year; so are the so-called dividend yielding / value stocks.

Total assets increase is driven by a combination of increasing net flows to the funds, number of new fund offers (NFOs) launched and general rise in stock market indices over a period of time. 


------------------------------
 
References:
 
SEBI circular dated 06Oct2017 on Categorization and Rationalization of Mutual 
Funds -- web archive for this circular - AMFI weblink for this circular

SEBI circular dated 04Dec2017 on Categorization and Rationalization of Mutual 
Funds -- web archive for this circular
 
Tweet embedded dt 11Sep2020 on SEBI Categorization and Rationalization of Mutual Funds 
 
SEBI circular 11Sep2020 on Asset Allocation of Multi Cap funds 
 
Tweet thread 11Sep2020 on expected Rs 40,000 crore "bonanza" after SEBI 
changed Multi Cap fund norms

Morningstar article 12Sep2020 on impact of SEBI's norms on Multi Cap funds

SEBI clarification 13Sep2020 on Asset Allocation of Multi Cap Funds
 
SEBI circular 06Nov2020  on Introduction of Flexi Cap funds 
 
Several tweets (search of SEBI categorization)
 
Tweet thread dt 22Feb2024 on  SEBI Categorization and Rationalization of Mutual 
Funds 

X post / Tweet thread dated 28Jan2024 on strange phenomenon of multi cap funds outperforming flexi cap funds
 
AMFI list: Categorization of Large-, Mid- and Small-cap stocks
 
AMFI list: PDF for half-year ending Dec2023
 
AMFI monthly data on AUM  

AMFI started publishing MF data in the current format (giving details as per Oct2017 SEBI norms on Categorization of MFs) effective from Apr2019
 
 
------------------------------
 
Related Blogs on Mutual Funds:
 
AMFI List of Market Cap: Categorization of Large-, Mid- and Small-cap stocks 17Feb2024  
 
Equity ETFs and Equity Index Funds Compared (passive funds)
 
Mutual Fund Asset Class Returns 31Dec2023 
 
BSE 500 versus S&P 500 Indices Compare (passive funds)
 
Indian Equity ETFs Worth Considering
 
Analysis of Nifty 100 Low Volatility 30 Index (passive funds)
 
Quarterly Data of MF Assets 31Mar2023
 
Understanding Corporate Debt Market Development Fund (CDMDF) 

Negative Impact of Debt Mutual Fund Tax Changes 
 
EPFO Investments in Stocks Via ETFs 
 
NSE Indices (Nifty 50, Nifty Next 50, Nifty 100 and Nifty 500) Comparison 31Dec2022

Why Do Indian Equity MFs Always Disappoint Investors?
 
Indian Mutual Funds and the Art of Ripping off Investors
  
Who is Eating My Gold ETF Return?
 
ETF Compare - Nifty BeES and Junior BeES 
 
Mutual Fund Asset Class Returns 31Dec2023 
 
Mutual Fund Asset Class Returns 30Sep2023
 
Mutual Fund Asset Class Returns 31Mar2023

Mutual Fund Asset Class Returns 31Dec2022

Mutual Fund Asset Class Returns 30Jun2022

Mutual Fund Asset Class Returns 31Mar2022
 
Mutual Fund Asset Class Returns 31Dec2021


-------------------

 
Read more:
 
Blog of Blogs Theme-wise 
 
AMFI List of Market Cap: Categorization of Large-, Mid- and Small-Cap Stocks
 
Stocks and Peer Comparison by Industry 
 
Zydus Lifesciences Buyback Offer 2024 
 
Equity ETFs and Equity Index Funds Compared
 
Mutual Fund Asset Class Returns 31Dec2023
 
BSE 500 versus S&P 500 Indices Compare 31Dec2023
 
NSE Indices Comparison 31Dec2023
 
Nifty 50 Index Yearly Movement 31Dec2023
 
JP Morgan Guide to Markets 31Dec2023
 
Global Market Data: 2013 to 2023
 
Kaveri Seed Company Buyback 2023
 
BSE Broad and Sector Indices Returns 31Dec2023
 
BSE Broad and Sector Indices Market cap 31Dec2023
 
Global Bond Yields Fall Sharply 
 
India: Prospects and Challenges
 
Buyback Offers and Weblinks
 
Negative Impact of Debt Mutual Fund Tax Changes

Weblinks and Investing

-------------------

Disclosure:  I've vested interested in Indian stocks and other investments. It's safe to assume I've interest in the financial instruments / products discussed, if any.

Disclaimer: The analysis and opinion provided here are only for information purposes and should not be construed as investment advice. Investors should consult their own financial advisers before making any investments. The author is a CFA Charterholder with a vested interest in financial markets. 

CFA Charter credentials  - CFA Member Profile

CFA Badge


Viewing Options for this blog in different formats:


He blogs at:

https://ramakrishnavadlamudi.blogspot.com/

https://www.scribd.com/vrk100

X (Twitter) @vrk100

Monday, 5 February 2024

Equity ETFs and Equity Index Funds Compared - vrk100 - 05Feb2024

Equity ETFs and Equity Index Funds Compared


(This is for information purposes only. This should not be construed as a recommendation or investment advice even though the author is a CFA Charterholder. Please consult your financial adviser before taking any investment decision. Safe to assume the author has a vested interest in stocks / investments discussed if any.) 
 

In investing life, simple products do well. Passive mutual funds are one of the easiest financial products to understand. 

With active funds, fund managers have the freedom to invest in a range of stocks or securities selected by managers themselves, subject to the investment mandate of a particular mutual fund scheme or plan. 
 
With passive funds, there is no such freedom for a fund manager to select stocks in a mutual fund scheme. The fund manager does not take a call on individual stocks, instead invests in the stocks that are part of an index in exactly the same weighting as the respective index.
 
 
1. Passive funds
 
In the investing world, there are two schools of thought: One school believes in beating the market and generate excess returns or alpha; and another school thinks you cannot beat the market, as per the principles enunciated in 'efficient market theory.'
 
People who believe in the former invest in active funds and those who believe in the latter invest in passive funds.
 
There is nothing wrong with these two approaches; both have their own merits and demerits. Investors have to decide which one to follow, depending on their investment objectives, time horizon and personal situation. 
 
One could say markets can be efficient sometimes and at other times inefficient. Veteran money managers and investors, like, Warren Buffet, Peter Lynch, Terry Smith and Joel Greenblatt have demonstrated the power of active fund management.
 
But as we have seen in the past 60 years globally, a majority of active funds have been consistently failing to outperform their benchmark indices -- meaning a majority of active funds are unable to outperform the returns generated by passive funds.
 
Selecting from a plethora of equity mutual fund schemes or plans is a challenge for most of the retail investors. Novice and unsophisticated investors are most of the time better off investing in passive funds.

This blog is written for educational purposes only aimed at retail investors in India and should not be construed as investment advice. 
 
The analysis in this blog is restricted to equity passive funds.
 
Unlike retail investors, institutional investors have a different investment mandate and are supposed to be more sophisticated compared to retail investors -- they tend to follow an investment approach different from that of retail investors.


(the blog continues below)

-------------------
 
Related Blogs on Mutual Funds:
 
Indian Equity ETFs Worth Considering
 
Analysis of Nifty 100 Low Volatility 30 Index
 
Quarterly Data of MF Assets 31Mar2023
 
Understanding Corporate Debt Market Development Fund (CDMDF) 

Negative Impact of Debt Mutual Fund Tax Changes 
 
EPFO Investments in Stocks Via ETFs 
 
NSE Indices (Nifty 50, Nifty Next 50, Nifty 100 and Nifty 500) Comparison 31Dec2022

Why Do Indian Equity MFs Always Disappoint Investors?
 
Indian Mutual Funds and the Art of Ripping off Investors
  
Who is Eating My Gold ETF Return?
 
ETF Compare - Nifty BeES and Junior BeES 
 
Mutual Fund Asset Class Returns 31Dec2023 
 
Mutual Fund Asset Class Returns 30Sep2023
 
Mutual Fund Asset Class Returns 31Mar2023

Mutual Fund Asset Class Returns 31Dec2022

Mutual Fund Asset Class Returns 30Jun2022

Mutual Fund Asset Class Returns 31Mar2022
 
Mutual Fund Asset Class Returns 31Dec2021


-------------------


2. ETFs versus Index funds
 
There are two types of passive funds. One is an exchange traded fund or ETF and another is an index fund. The speciality of ETFs is they are traded on stock exchanges, like, stocks. 
 
Table 1 compares ETFs and Index Funds:
 

The main difference between ETFs and index funds: Investors can directly buy ETF products through stock exchanges, unlike index funds which have to be transacted directly through mutual funds.
 
When you invest directly in an index fund through the mutual fund, the investor incurs no trading costs; but while buying or selling ETFs on stock exchanges, an investor has to bear trading costs, like, brokerage cost, securities transaction tax (STT) and other taxes, stamp duty and others.
 
With index funds, investors can choose to invest in regular or direct plans; and they have the choice of investing in growth and dividend options too. With ETFs, investors do not have such options.
 
Index funds provide the facility of a systematic investment plan (SIP), which is a concept well known as dollar-cost averaging -- whereby investors can invest regularly on a monthly basis Now, mutual funds provide daily SIP facility also.
 
But ETFs do not provide SIP facility.
 
Institutional investors, in general, prefer to invest in ETFs rather than index funds, because they can do in-kind creation / redemption with minimal cost by directly dealing with the mutual fund. 
 
With in-kind mechanism unique to ETFs, large investors can invest in units of ETFs by paying in cash in exchange for a basket of securities. And the same mechanism in reverse can be used by them for selling / redeeming units of ETFs and receive cash in lieu of units sold.

The creation unit size may differ from one ETF to another. For example, if a large investor wants to invest more than Rs 25 crore in an ETF, say, Bandhan Nifty 50 ETF, she can directly approach the fund house and buy ETF units by paying cash.
 
 
3. Portfolio construction
 
Portfolio construction of a passive fund is easy for a fund manager. The manager just needs to mimic or mirror the stocks underlying an index in the same proportion. 
 
Passive funds need to match an index that is linked to them. They need to hold the stocks (or other securities) underlying the index. Passive funds need to hold the stocks in the same proportion as they are in the underlying index. 

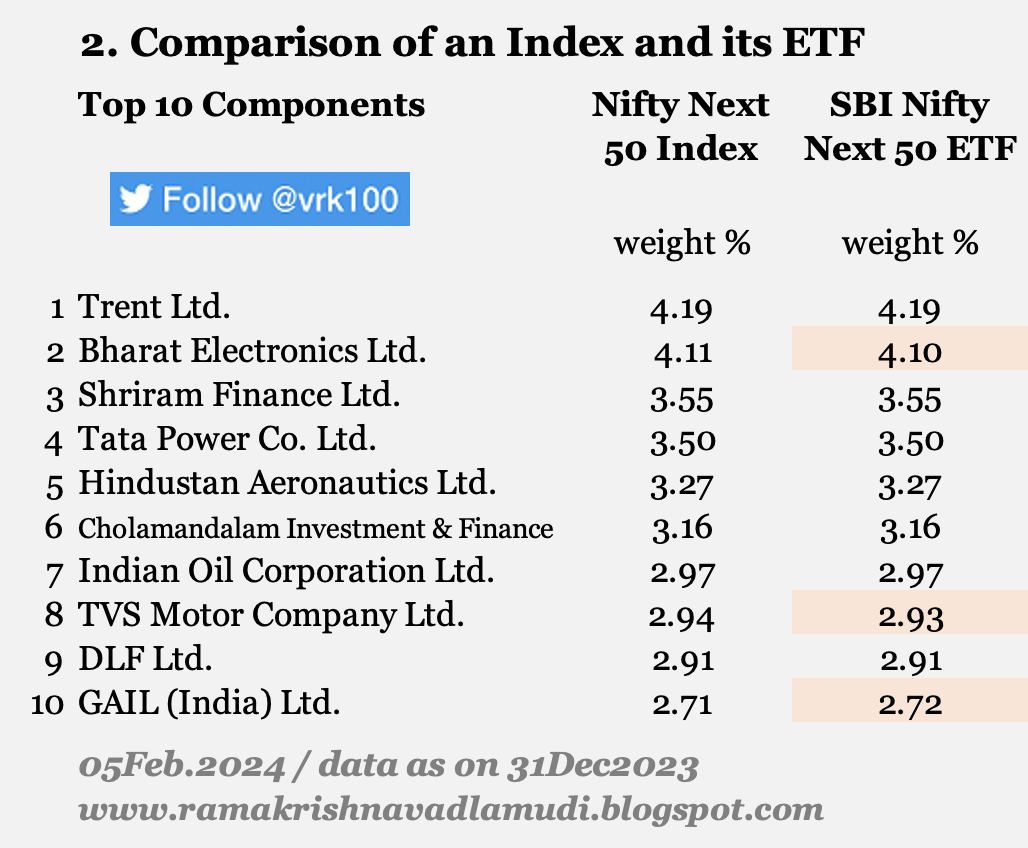
Let us for example consider an ETF named SBI Nifty Next 50 ETF.  The ETF's underlying benchmark index is Nifty Next 50. Nifty Next 50 index is a popular index with 50 stocks and its index service provider is NSE Indices Limited. 
 
The ETF needs to invest in stocks proportionately as they are in the index and closely match the return performance of the Nifty Next 50 index.

Table 2: Top 10 stocks in Nifty Next 50 and SBI Nifty Next 50 ETF:


As can be seen from table 2 above, the ETF's underlying stocks are in the same proportion as they are in the underlying index. Only three stocks, namely, Bharat Electronics and TVS Motor Company and GAIL (India) have slightly different weights compared to the benchmark.
 
Even though there are 50 stocks in the Nifty Next 50 index and the ETF, only 10 stocks are shown in the table 2 above for illustration purpose.
 
Whenever the index service provider changes the composition of the index, the fund manager too changes the composition of the ETF as per the benchmark, in order to closely match the return performance of the underlying index.
 
Passive funds are low-cost investment vehicles that provide broad market exposure, portfolio diversification and low portfolio turnover.  

As per capital market regulator, Securities and Exchange Board of India or SEBI, the maximum expense ratio index funds and ETFs can charge is 1.00 percent; whereas it's 2.25 percent for open-end equity oriented schemes of active funds.

The risks of investing in passive funds are highlighted here and here. One can also check other various blogs written by the author.
 
As at the end of December 2023, the total assets under management (AUM) of equity passive funds (both equity ETFs and equity index funds) is Rs 6.19 lakh crore as per data from Value Research Online. 

Let us see how index funds based on specific indices fare among themselves and with exchange traded funds.
 
 
4. Comparison of Equity ETFs and Equity Index Funds:
 
Table 3: List of Select passive funds: Risk metrics, Rating, expense ratios and asset size >  
 
Please click on the image to view better >


Asset size or assets under management (AUM) data in table 3 above are as at the end of 31Dec2023. 
 
Table 4: List of Select passive funds: long-term returns >
 
Please click on the image to view better >


All the trailing returns data presented in Table 4 above are as at the end of 02Feb2024; and 3-year, 5-year and 10-year data are annualised, that is, they are compounded annual growth rates (CAGR).

Index funds' data in table 4 are for direct plans / growth options. And mutual fund category returns are for direct plans / growth options and they are simple average returns, not asset-weighted.
 
Table 4 also contains total return (including dividends) data of the underlying indices of the select passive funds. By comparing passive funds' returns with the returns of underlying indices, investors will be able to assess whether the passive funds are able to closely match the return performance of the underlying indices.

Data of a few equity categories, like equity large cap and equity flexi cap, are included to enable readers to see whether active funds are outperforming passive funds.

It may be added funds under equity large cap and flexi cap categories are active funds.
 
Tables 3 and 4 contain data pertaining to 16 passive funds, eight equity ETFs and eight equity index funds -- based on six equity indices, namely, Sensex, Nifty 50, Nifty Next 50, Nifty 100, Nifty 500 and BSE 500.
 
The following filters are used to arrive at the above eight passive funds:
 
(i). funds with AUM of less than Rs 250 crore are removed (only ICICI Prudential S&P BSE 500 ETF is included for comparison purposes).

(ii). funds with less than 3-year record are removed.

(iii). Nifty 50 and Sensex ETFs of SBI MF and UTI MF are removed as they suffer from big investor risk. This is a unique risk (EPFO risk) peculiar to Indian ETFs. 
 
(iv). Thematic, sectoral and international funds are not considered for the analysis.
 
(v). Bharat 22 and CPSE ETF are ignored as they are based on narrow indices. 

There are a number of passive equity schemes based on Sensex and Nifty 50. So is not the case with other indices. 
 
The age of various passive funds is less than five years. When the number of funds linked to an underlying index and with no long-term history, it is hard to assess such passive funds on a long-term basis.
 
Compared to developed countries, like, the US and the UK, Indian passive funds are fewer in number and are less popular.
 
 
5. Observations from return data of Table 4:

> there is not much difference between trailing returns of ETFs and index funds
 
> the author used to believe equity ETFs were better than index funds -- but after observing the data, especially of passive funds based on Sensex and Nifty 50, one can see there is not much difference between returns of ETFs and index funds on a long term basis.
 
> passive funds based on Sensex and Nifty 50 are able to closely match the returns of Sensex and Nifty 50 -- the difference is negligible for investors with long term orientation
 
> as only a few passive funds are available for other indices, like, Nifty 100, Nifty 500 and BSE 500, one cannot assess whether they will be able to closely match the performance of underlying indices
 
> if you compare the trailing returns of passive funds with those of active funds (large- and flexi-cap funds specifically), active funds have outperformed passive funds as on the date of analysis, that is, 02Feb2024
 
> but when you compare trailing returns as at end of prior periods, one can say active funds' performance is not superior to that of passive funds
 
> one could also argue that as Indian equity markets are near their all-time highs, active funds as a category on a trailing basis are outperforming passive funds currently
 
> the real test for active funds is during market downturns
 
> as we have seen during the 2008 Global Financial Crisis and prior to and around COVID-19 Pandemic, active funds as a category have consistently failed to generate superior returns versus their passive peers


6. Passive Funds Worth Considering

As argued many times (see equity ETFs worth considering), it is better for novice investors to stick to passive funds based on Nifty 50 and Sensex -- as they provide a lot of funds from different fund houses.

It is not necessary you need to invest only in funds mentioned in table 3 and 4 above -- the list is just for illustration purposes (for a bigger list of passive funds, see raw data in tables 5, 6, 7 and provided below under 'Additional Data'). 

Based on convenience, time horizon and one's investment objectives, investors can choose between index funds and exchange traded funds (see Section 2 and 3 above). 

It may be repeated this blog is just for educational purposes (the author has written more than 400 blogs on a variety of topics in the past 15 years) and should not be construed as investment advice. Investors should consult their own advisers before making any investment decision.

 
 - - -
 
------------------------------
 
References and Additional data:
 
Nifty Passive insights - PDF for Dec2023
 
NSE Indices return data (including historical data on a specific date) 

BSE Sensex total return (Sensex TRI) data
 
Comparision of all passive funds (equity ETFs and equity index funds) VR
 
Edelweiss MF converted two ETFs into index funds in Oct2021
 
Morningstar gives tracking error data in its factsheets and compare weblink 
 
Compare funds ETFs / index funds Tweet  12Jun2021

Compare funds ETFs / index funds Tweet 13Jun2021

Compare funds ETFs / index funds Tweet 13Jun2021


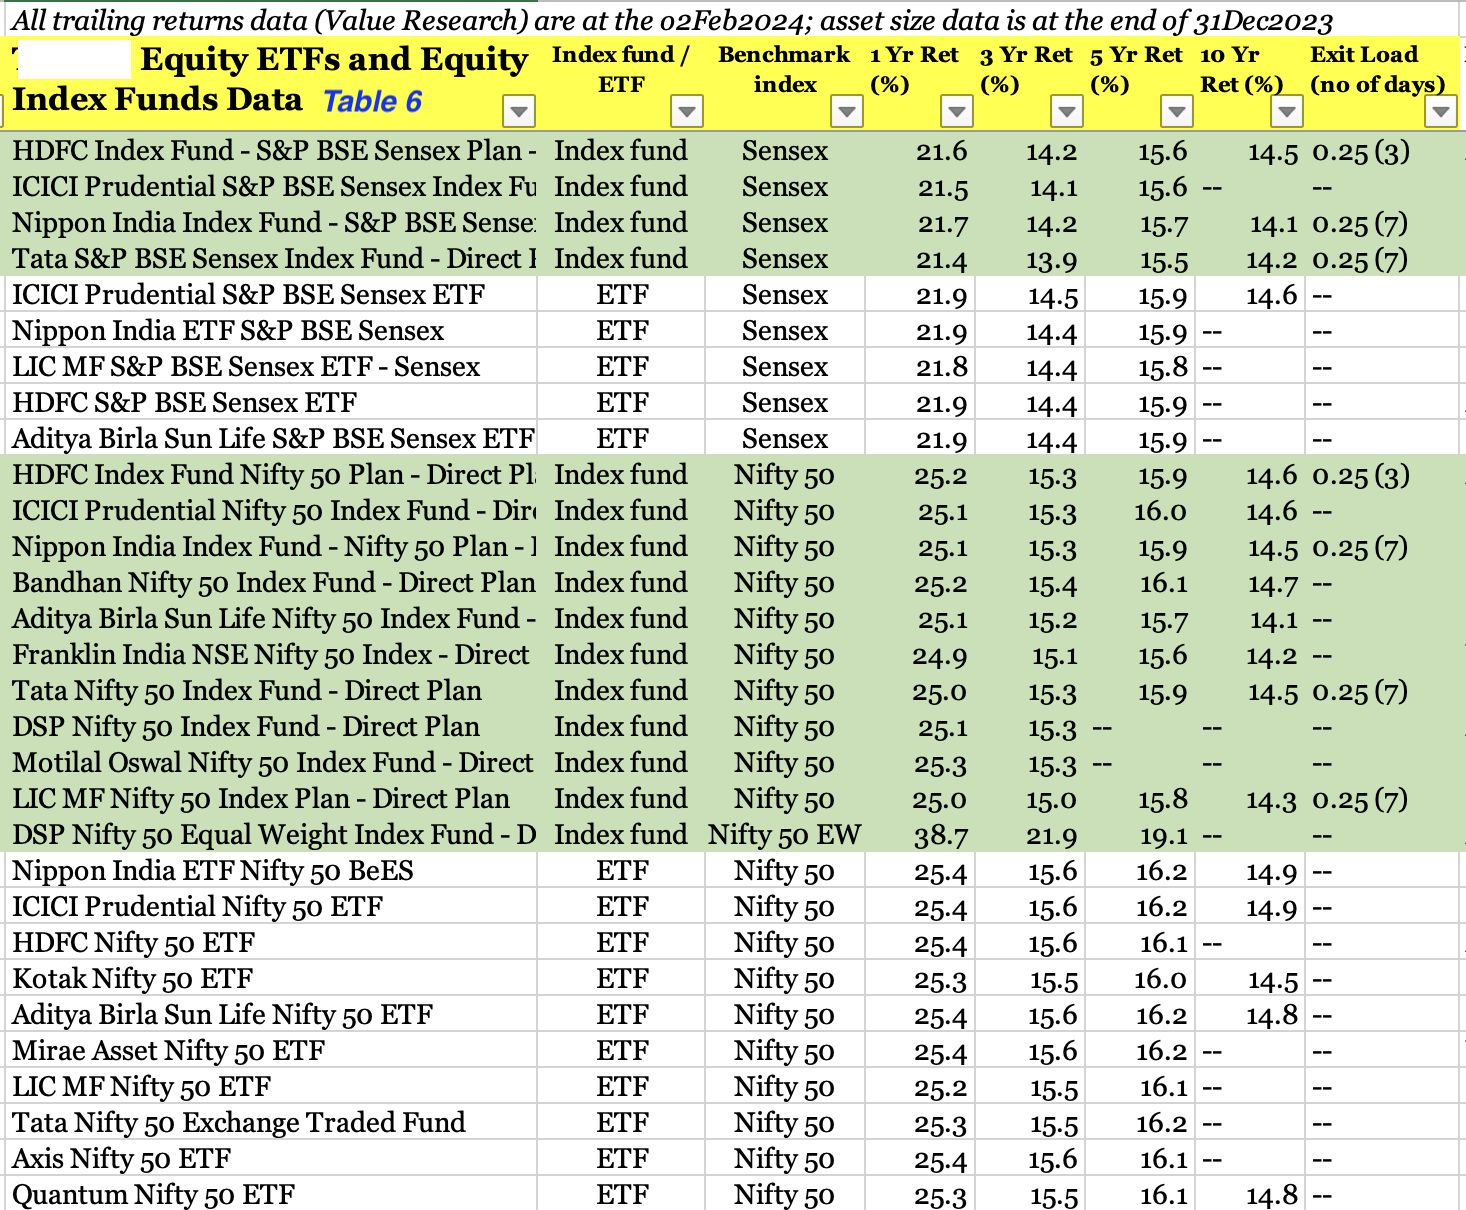
Raw data (from Value Research): Table 5, 6, 7 and 8 >
 
(trailing returns data are as at the end of 02Feb2024; asset size data at the end of 31Dec2023; equity index funds' data are for direct plans / growth options and simple averages, not asset-weighted)


------------------------------
 
Read more:
 
Blog of Blogs Theme-wise 
 
Mutual Fund Asset Class Returns 31Dec2023
 
BSE 500 versus S&P 500 Indices Compare 31Dec2023
 
NSE Indices Comparison 31Dec2023
 
Nifty 50 Index Yearly Movement 31Dec2023
 
JP Morgan Guide to Markets 31Dec2023
 
Global Market Data: 2013 to 2023
 
Kaveri Seed Company Buyback 2023
 
BSE Broad and Sector Indices Returns 31Dec2023
 
BSE Broad and Sector Indices Market cap 31Dec2023
 
Global Bond Yields Fall Sharply 
 
Global market data 31Dec2023
 
India Per Capita Income in Dollars
 
RBI Annual Report and HBIE  - Data Tables
 
India Foreign Exchanges Reserves Comfortable 
 
 
India Debuts 50-year Sovereign Bond

India: Prospects and Challenges
 
Buyback Offers and Weblinks
 
Negative Impact of Debt Mutual Fund Tax Changes

Weblinks and Investing

-------------------

Disclosure:  I've vested interested in Indian stocks and other investments. It's safe to assume I've interest in the financial instruments / products discussed, if any.

Disclaimer: The analysis and opinion provided here are only for information purposes and should not be construed as investment advice. Investors should consult their own financial advisers before making any investments. The author is a CFA Charterholder with a vested interest in financial markets. 

CFA Charter credentials  - CFA Member Profile

CFA Badge


Viewing Options for this blog in different formats:


He blogs at:

https://ramakrishnavadlamudi.blogspot.com/

https://www.scribd.com/vrk100

X (Twitter) @vrk100