Mutual Funds Asset Class Returns 31Dec2021
(A new blog post is available here with an update of the information as of 31Mar2022)
Asset class returns move in cycles. Gold did well in 2019 and 2020, but produced negative returns in 2021. Indian equities have done well in 2020 and 2021, but did poorly in 2018 and 2019. This can be observed by following how mutual funds have delivered over the years.
I present below data pertaining to fifteen carefully selected mutual fund categories ranging from stocks, bonds and commodities. This is a sample of several mutual fund categories that are available to investors investing in Indian mutual funds.
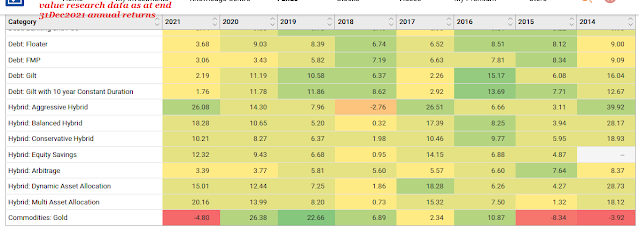
Table 1: Asset return matrix - annual returns - top to bottom returns in 2021 >

In calendar year 2021, funds belonging to equity small cap category have delivered the highest returns at 63 per cent, following by mid cap equity at 45 per cent and large cap with 32 per cent.
At the bottom of 2021 was gold with a return of minus 4.80 per cent--the other two at the bottom are gilt funds with 2.20 per cent return and liquid funds at 3.20 per cent. It may be mentioned that being in the nature of cash liquid (debt) funds tend to deliver the lowest returns in general.
One could compare returns of other categories, like, hybrid funds, other debt and equity funds also. The annual returns are presented from 2014 to 2021.
-------------------
Read more:
GE Shipping Company buyback offer
Saver's curse: Low Savings Rates and Liquid Mutual Fund Returns
JP Morgan Guide to Markets Aug2021
Global bond yields and Interest rates
Do Paint Stocks and Crude Oil Tango?
BSE Broad and Sectoral Indices Returns
Real Estate Stocks and REITs
Weblinks and Investing
-------------------
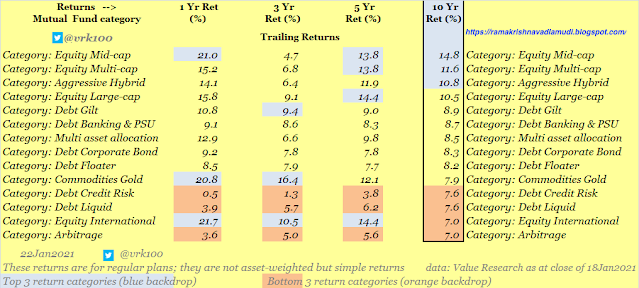
Table 2: Asset return matrix - trailing returns - 10-year returns top to bottom >

On a trailing basis for 10 years, equity small cap category (22.2 per cent CAGR) is on the top of the heap, followed closely by equity mid cap funds at 21 per cent CAGR and equity flexi cap funds at 16.6 per cent CAGR.
The trailing returns for 10-year and other longer periods are influenced more by the returns generated in the last two years. Equity small cap category generated highest returns both in 2020 and 2021 pushing up the 10-year annualised returns considerably.
Gold delivered the lowest annualised returns for 10 years among the select fund categories. Its 10-year CAGR returns are 4.6 per cent--it failed to beat even inflation also. Other funds at the bottom for 10-year returns are arbitrage with 6.6 per cent CAGR and liquid funds with 7.1 per cent CAGR.
The key takeaway for mutual fund investors is to take exposure to different mutual fund categories based on their investment goals and personal needs and have a proper asset allocation.
Additional data
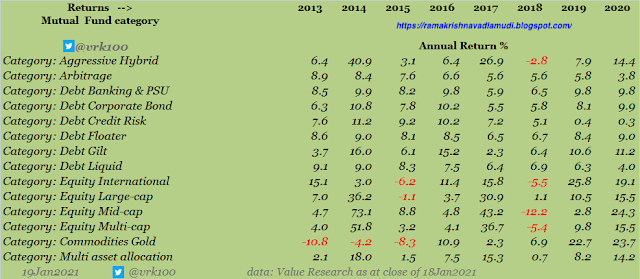
Table3: Asset return matrix -- annual returns - same as Table 1 but in alphabetical order >

Table4: Asset return matrix -- trailing returns - same as Table 2 but in alphabetical order >

Below are screenshots of Annual and Trailing returns of all mutual fund categories culled from Value Research Online as of 31Dec2021 >


- - -
CAGR returns - compounded annual growth rate returns or annualised returns
For past data containing several tables, check my tweets: tweet 02Apr2021 tweet 19Jan2021, tweet 19Jan2021, tweet 01Jul2021 and various other tweets on asset class returns and asset return matrix.
P.S.: The following are added after 17Jan2022 for reference purpose >
Tweet with VR annual returns with VR screenshots as of 30Jun2021
VR data trailing returns with VR screenshots / asset class returns as of 31Mar2021
VR data annual returns with VR screenshots as of 31Mar2021 - mutual fund returns - equity - debt - gold - ETF - international - liquid - arbitrage -


VR data as on 18Jan2021 - tweet 1 and tweet 2 >


My tweet 19Jan2021 - asset class return matrix - equity - debt - gold - ETF - international - liquid - arbitrage - individual fund returns - debt/ hybrid, gilt, equity, multi asset allocation funds >


My tweet 19Jan2021 - "There is practically no difference between returns generated by ELSS and Multi-cap equity categories--either in the annual or trailing returns across time periods."
VR data as on 31Dec2020 (with VR screenshots) asset class returns / gold fund returns - tweet 1, tweet 2 and tweet 3
Disclosure: I've vested interested in Indian stocks and other investments. It's safe to assume I've interest in the financial instruments / products discussed, if any.
Disclaimer: The analysis and opinion provided here are only for information purposes and should not be construed as investment advice. Investors should consult their own financial advisers before making any investments. The author is a CFA Charterholder with a vested interest in financial markets.
CFA Charter credentials - CFA Member Profile
CFA Badge
He blogs at:
https://ramakrishnavadlamudi.blogspot.com/
Twitter @vrk100
No comments:
Post a Comment