India Equity ETF Risks and Returns 31Dec2021
Follow @vrk100
Investors are in the habit of piling into the latest fads, be it Dogecoin, which started as a joke, or such others. Human greed is ubiquitous and timeless. Globally, passive funds have been dominating the mutual fund flows for a decade or so.
Passive funds include both exchange traded funds (ETFs) and index funds. The speciality of ETFs is they are traded on stock exchanges, like, stocks. Investors can directly buy them through stock exchanges, unlike index funds which have to be transacted directly through mutual funds.
-------------------
Read more:
BSE Broad and Sector Indices Returns 31Dec2021
Modi Rally, Recency Bias and Stock Market Returns
Mutual fund asset class returns
GE Shipping Company buyback offer
Saver's curse: Low Savings Rates and Liquid Mutual Fund Returns
Indian Mutual Funds and The Art of Ripping Off Investors
Do Paint Stocks and Crude Oil Tango?
Weblinks and Investing-------------------
ETF Assets
This passive trend has started in India also, especially with equity mutual funds. In the past 10 years (between Dec2011 and Dec2021), ETF assets (excluding gold ETFs) have grown from Rs 1,500 crore (Dec2011) to Rs 384,000 crore (Dec2021)--a whopping absolute growth of 25,260 per cent or an annualised growth of 74 per cent.
The absolute growth in the past five years is 1,230 per cent and it's 116 per cent in the past two years (see table 1 below for details).
Table 1: ETF Assets >

For three to five years through 2020, diversified equity funds (excluding sector and thematic funds) massively underperformed passive funds based on broad indices, like, Sensex, Nifty 50 and Nifty 100. Put differently, diversified equity funds have failed to beat their counterpart passive funds. (This has been well-telegraphed globally too for several decades. To be fair, performance of diversified equity funds improved in 2021 thanks mainly to broad-based rally.)
As a result, passive funds (ETFs and index funds) gained traction in India too. The size of index funds is smaller as compared to the size of ETFs. As at the end of December 2021, the asset size of index funds is Rs 45,400 crore as against the ETF assets of Rs 384,000 crore.
ETF Returns
Let us examine how the equity exchange-traded funds have been doing over the years. For this analysis, I've excluded sector and thematic funds, based on indices, like, Bank Nifty, Nifty IT, BSE IPO and Nifty Pharma. Also excluded are equity ETFs based on foreign indices, like, Nasdaq.
Table 2: ETF Returns as on 31Dec2021 (data from RupeeVest; 2-year to 10-year returns are annualised) >

As the above table 2 shows, the assets of top three ETFs (based on Sensex and Nifty 50 indices) have a share of more than 50 per cent in the total ETF assets. Since August 2015, India's top pension fund, EPFO, has been investing in Indian equity mutual funds through the ETF route--specifically ETFs based on Sensex and Nifty 50.
EPFO has also been investing in CPSE ETF and Bharat 22 ETF, specialised ETFs constructed with underlying stocks mostly from listed stocks of state-owned entities (SOEs).
As such, these ETFs based on Sensex, Nifty 50, CPSE and Bharat 22 indices suffer from this big investor risk, that is, EPFO risk--in the sense, these mutual fund managers have to cater to the needs of EPFO.
There are several instances in recent years, where these ETFs declared dividend (Livemint 31Mar2021) from ETFs to satisfy the needs of the EPFO. This leads unsuspecting investors to suffer tax payment as a result of the unanticipated cash inflows.
To the best of my knowledge, ETFs declaring dividends is unheard of in the mutual fund industry.
Active funds
Back in January 2020, I did a brief analysis of concentration risk of diversified equity funds versus ETFs (table 3 below). You could observe these active funds too are concentrated; but the ETF based on Nifty 50 is more concentrated.
Passive funds (ETFs and index funds) can't hold cash and the stocks / sectors they hold is subject to the decisions of the committee of BSE or NSE.
In theory, an active fund manager can control concentration risk in various ways--for example, by having a well-diversified portfolio across stocks, sectors and holding higher cash levels at times.
Table 3: ETFs vs diversified funds >

ETF Risks
Several equity ETFs in India suffer from lack of market breadth and liquidity, that is, their asset size is small and their volumes on stock exchanges (NSE and BSE) are extremely low. I've excluded such ETFs from the analysis (but a few low-volume ETFs are included just for comparison purposes).
In calendar year 2021, Indian stocks delivered spectacular returns amidst the COVID-19 Pandemic. Overall, in the past two years, Indian listed stocks have provided decent returns despite the non-linear, stomach-churning nature of stock market returns.
As a result, the trailing returns (table 2 above) for the past three- and five-years appear to be on the higher side (with most providing high double-digit returns), compared to their historical returns.
Table 4: Equity ETF Characteristics (capitalisation and risk ratios) >

Table 4 provides details relating to capitalisation and risk ratios of the selected ETFs. The standard deviation of the funds is between 15 and 16, which is quite common with equity funds. And these funds are dominated with large-cap stocks, even some have 100 per cent exposure to large-cap stocks.
ETF Concentration Risk
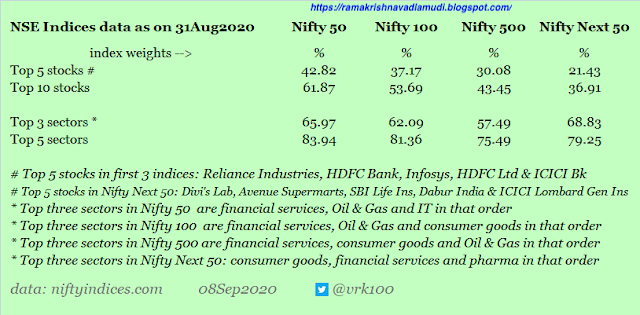
I've often argued that most of the equity ETFs in India are not suitable for the average investor, that is, unsophisticated / novice investors. Several ETFs suffer from high concentration risk, in the sense, top ten stocks dominate the indices due to the concentration inherent in free float market capitalisation indices.

But for this high concentration risk (indices represented by high concentration of four or five stocks and / or three or five sectors), one could have invested in low-cost equity ETFs, enjoying market returns and avoiding fund manager risk inherent in actively managed funds. Another problem with ETFs based on broad-based indices (like, BSE 100, BSE 500, NSE 100, NSE 500, etc.) is their assets are too low. Only LIC MF ETF Nifty 100 has a decent asset size of Rs 485 crore (table 2 above). Asset size of other ETFs based on Nifty 100 and BSE 500 is negligible.
Of course, global stock ETFs in the US and other nations too suffer from this concentration risk. Maybe, concentration risk is a feature, not a bug, of the financial markets industry.
As such, neophyte investors should stick to disciplined investing through only a few select ETFs, based on the criteria of high diversification, low concentration, medium-asset sized funds and high traded volumes. ETF volumes--daily and monthly volumes are available--on NSE can be accessed here.
Both big-sized and small-sized funds have their own concentration issues (this is just my gut feeling; I haven't analysed the data to buttress my argument).
If most ETFs are to be avoided, the natural question is: Which ETFs are suitable for investors? We need another blog and more analysis to answer this question. 😃 Until then, all wishes for happy investing!
- - -
Abbreviations used:
AMFI - Association of Mutual Funds in India
EPFO - Employee Provident Fund Organisation
NSE - National Stock Exchange of India Ltd
References:
Tweet thread 07Jun2021 - compare funds / ETFs - BSE 500 ETF, concentration risk, etc.
Tweet 22May2021 - Nippon India ETF Junior BeES > raw data 30Apr2021 >


Three Tweets 20May2021 - one, two and three - data 30Apr2021 - top stocks / sectors - risk measures -total return - valuation ratios - raw data - Nifty 50, Nifty Next 50, Nifty 100 and Nifty 500 -


Tweet 20May2021 - Compare funds / ETFs based on broad-based indices - BSE 500 ETF, Nifty 100 ETF, etc. (includes Nifty 50 and Nifty Next 50) - Nippon India ETF Nifty BeES vs Nippon India ETF Junior BeES -


Tweet thread 05Jan2021 - Nifty 50, Nifty 100, Nifty 500 and Nifty Next 50 indices 31Dec2020 data >


Tweet 18Dec2020 - compare funds 2020, ETFs based on Nifty 50, Nifty Next 50, CPSE and Bank Nifty -


Tweet 08Sep2020 - data 31Aug2020 - Compare funds / ETFs based on broad-based indices - BSE 500 ETF, Nifty 100 ETF, etc. (includes Nifty 50 and Nifty Next 50) - top sectors and stocks - raw data 31Aug2020 -


Tweet 01Sep2019 - compare funds / ETFs based on Broad indices, like, Nifty 50, Nifty Next 50 (Junior Nifty), etc.


Tweet 02Aug2019 - Compare funds / ETFs based on broad-based indices - BSE 500 ETF, Nifty 100 ETF, etc. (includes Nifty 50 and Nifty Next 50)


Tweet thread 15Oct2018 - Compare funds / ETFs based on broad-based indices - BSE 500 ETF, Nifty 100 ETF, etc.


Tweet thread 01Sep2019 - Compare funds / ETFs - Reliance ETF Nifty BeES vs Reliance ETF Junior BeES > portfolio characteristics since 2002 / 2003 till now > concentration risk, diversification - data as on 31Aug2019 > tweet 01Sep2019 expense ratio of a few ETFs


Tweet 01Sep2019 - compare Reliance ETF Junior BeES (Nifty Next 50) and Reliance ETF Nifty BeES - Junior BeES did better over 5-year and 10-year period - scores of two ETFs -


Old data Oct2009 - Tweet 02Aug2019 - JP Associates was top stock in Nifty Next 50 (then Junior Nifty) in Oct2009


Disclosure: I've vested interested in Indian stocks and other investments. It's safe to assume I've interest in the financial instruments / products discussed, if any.
Disclaimer: The analysis and opinion provided here are only for information purposes and should not be construed as investment advice. Investors should consult their own financial advisers before making any investments. The author is a CFA Charterholder with a vested interest in financial markets.
CFA Charter credentials - CFA Member Profile
CFA Badge
He blogs at:
https://ramakrishnavadlamudi.blogspot.com/
Twitter @vrk100
No comments:
Post a Comment