Who is Eating my Gold ETF Return?
(This is for information purposes only. This should not be construed as a recommendation or investment advice even though the author is a CFA Charterholder. Please consult your financial adviser before taking any investment decision. Safe to assume the author has a vested interest in stocks / investments discussed if any.)
(Updates 17Apr2026, 20Jan2026, 20Jan2026, 11Jan2026, 28Dec2025, 02Dec2025, 02Dec2025, 27Oct2025, 14Sep2025, 14Sep2025, 22Jul2025, 21Apr2025, 18Jan2025, 20Oct2024, 10Jul2024, 02May2024, 15Jan2024, 16Oct2023, 30Apr2023, 13Jan2023, 23Oct2022 and 08Jul2022 with new information are available at the end of this blog post)
One of the investment avenues available for investors is gold exchange traded fund or ETF. Exchange traded funds are traded on stock exchanges, similar to stocks. They are convenient and can be bought and sold during market hours on stock exchanges.
Gold ETFs are expected to track the performance of their underlying asset, that is, gold. As per the National Stock Exchange, there are eleven gold ETFs in India.
An analysis of their returns shows that the gold ETFs are unable to match the returns of the underlying asset, that is, gold. In general, ETF investment vehicle will be under-performing the underlying asset to some extent, due mainly to tracking error and fund management expenses.
-------------------
Read more:
NSE Indices Comparison
Foreign Investors Waning Interest in Indian Stocks
RBI Bought 200 tonnes of Gold
7 Reasons why Gold Monetization Scheme will be a failure
FPI Flows into Indian Stock Market
Indian Equity ETF Risks and Returns
RBI Issues New 10-year G-Sec Paper
Modi Rally, Recency Bias and Stock Market Returns
Do Paint Stocks and Crude Oil Tango?
Weblinks and Investing-------------------
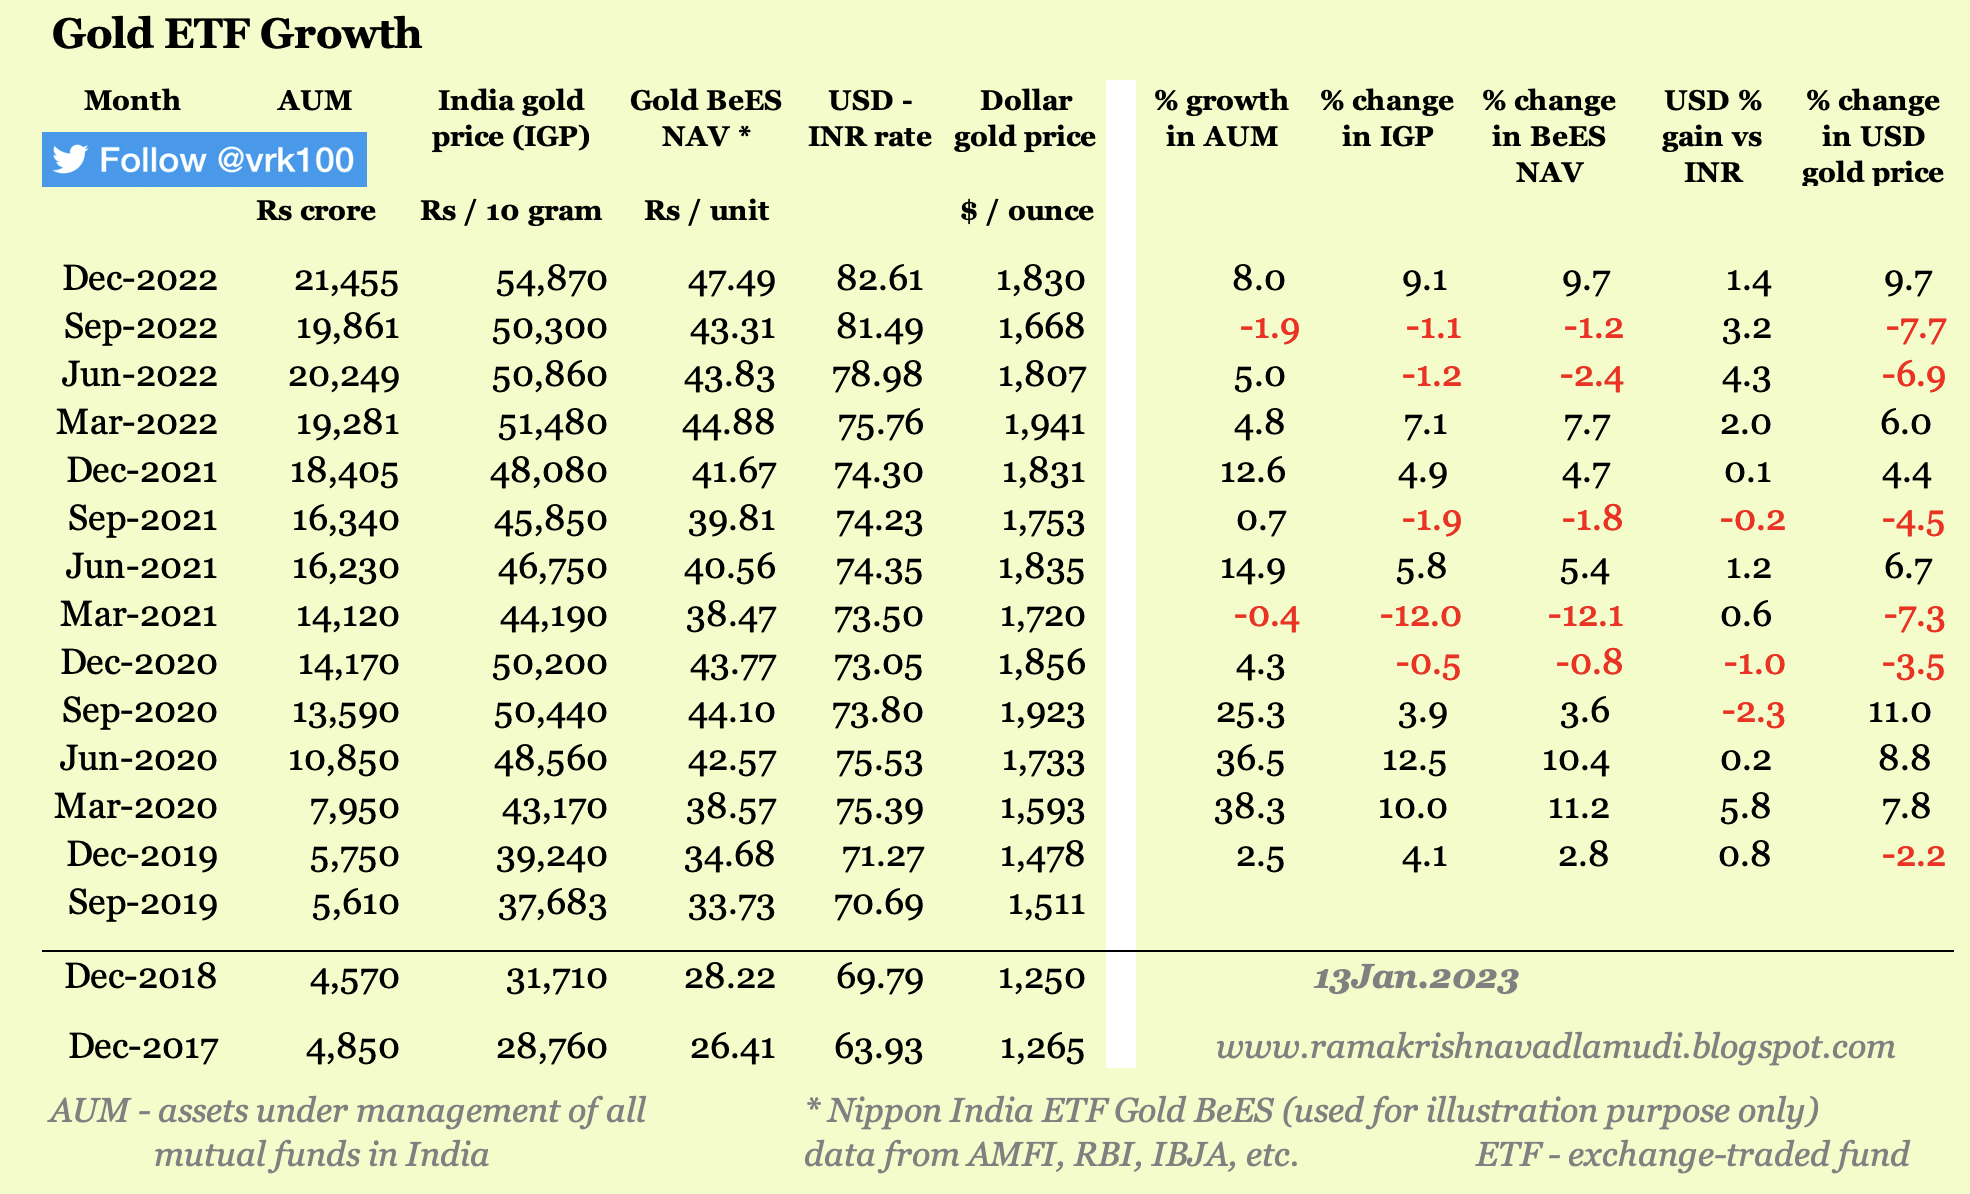
The following table presents quarterly data of gold ETFs: (please click on the image for better view) >

Gold ETF Returns
Let us look at the data in the above table. In the past four years (between Dec2017 and Dec2021), gold price grew by 67 per cent from Rs 28,760 to Rs 48,080 (gold price for 10 grams with 999 fineness).
Whereas, a gold ETF's net asset value increased by only 57 per cent from Rs 26.40 to Rs 41.70--this is the NAV of Nippon India ETF Gold BeES fund (this fund is used just for illustration purpose -- returns of other ETFs are on similar lines).
Over a four year period, the difference is 10 percentage points between the ETF and the underlying asset. This difference is huge considering the fact that gold as an asset routinely fails to beat inflation rate in India.
If an investor were to invest for longer time period, say, 10 or 15 years, her gold ETF returns will be eaten away by fund management expenses.
Expense ratios of these gold ETFs range from 0.35 to 0.80 per cent. Globally, expense ratios of gold ETFs are more competitive. Of course, size of the asset class also matters. Indian gold ETFs have puny asset size compared to their global peers.
Gold ETF asset growth
Whenever the gold prices rise, investors tend to flock to gold ETFs as a short term opportunity. This can be observed from the quarterly data of asset growth shown above (it may be added that asset size growth depends on fresh inflows / outflows and the increase / decrease in the gold price).
For example, in 2019 and 2020, gold ETF assets have grown by almost three times as gold price in rupees had risen by 68 per cent from Rs 31,710 in Dec2018 to Rs 50,200 in Dec2020.
As gold price remained subdued in 2021, the growth in assets remains much lower as compared to 2019 and 2020.
Gold Price Drivers
Gold prices in India are driven mainly by international gold price (denominated in US dollars) and the exchange rate of the US dollar and Indian rupee.
For several decades, rupee has been depreciating against the US dollar. As such, gold prices in India have shown big increases thanks to the rupee depreciation.
As can be observed from the data presented above, the US dollar appreciated from 63.93 to 74.30, between Dec2017 and Dec2021, a gain of more than 16 per cent for the US dollar.
Interestingly, international gold price grew by only 44.7 per cent between 2017 and 2021. But India gold price grew by 67.2 per cent--the difference is due to rupee's depreciation versus the US dollar.
To Sum Up
Investors need to be aware of the above price dynamics and the return erosion from high expense ratios of the gold exchange traded funds in India. This is just for educational purpose and should not be construed as investment advice.
As an asset class, gold has been frustrating global investors in the past 20 months.
The loss of investor interest in gold is often attributed to the spectacular rise of crypto assets (like, Bitcoin, Ethereum and Solana) since the outbreak of the Corona Virus in 2020. It is said that crypto currencies are eating gold's lunch.
But since the beginning of this year, crypto assets have lost USD 600 billion in market cap or 26.7 per cent of their total value--whereas gold remained steady in the same period, that is, year-to-date.
Gold has often been presented as an inflation hedge. This thesis also seems to be not working at the market level currently. With inflation running very high in the US (7 per cent consumer price inflation last month) and other major nations, gold price remains lacklustre in 2021.
In my opinion, gold as an asset is useful only for diversification purposes. In an age when fiat currencies are losing their purchasing power continually over several decades, gold may present a viable alternative in the next three to five years for long-term patient investors.
- - -
---------------------------
P.S.: Update dated 17Apr2026: India Gold Price: Gold ETF growth: quarterly growth rates as at close of 31Mar2026 >
The AUM of gold ETFs as of Mar2026 is Rs 1.71 lakh crore. In the past one quarter alone, the assets grew by 34 per cent. In the same period, gold price in USD rose by 7.8 per cent while rupee depreciated by 5 per cent versus the dollar.

---------------------------
P.S.: Update dated 20Jan2026: India Gold Price Annual Return / India Gold Price Calendar Year Return: Yearly return of domestic gold price vs USD gold price (using Forbes India gold price) vs USD INR change vs Nifty 50 TRI:
Check Update 20Jan2026 below with Chart showing domestic price of gold vs dollar gold price vs Nifty 50 TRI and Nifty 50 outperformance (using Nippon India MF gold price)
Check blog 'Indian Economy Data Bank' for update 02Dec2025 with chart 90 for annual return of India gold price (using Nippon India MF gold price), world gold price and USD gain vs INR
Indian economy data bank: update 02Dec2025 with chart 89 - Sensex vs gold price (using Forbes India price)
See also Update 03Jan2026 with charts 162 and 163 of blog: Forex Data Bank (25-year data on USD gain vs INR -- both calendar year and financial year data)
Sensex versus gold price 29May2024 (data 2000 - 2024)
Understanding Real Sensex and Currency Debasement (only financial year wise Sensex and CPI inflation data from 1990 to 2024) 14Mar2024
Overall pattern:
Sensex and gold alternate leadership. There is no permanent winner; relative performance is highly cycle-dependent.
Recent trend:
Post-2022, gold has consistently beaten Sensex, culminating in a very large gap in 2025. This suggests elevated macro uncertainty and risk aversion.
25-year balance between Sensex and gold:
From 2001 to 2025, Sensex TRI has outperformed gold in 13 out of 25 years, confirming that equities maintain a slight edge over a full market cycle when dividends are included (see below chart showing Sensex total return vs domestic price of gold return).
Sensex TRI is total returns including dividends.
Shift in the last decade:
However, between 2016 and 2025, gold outperformed BSE Sensex TRI in seven of 10 years, a sharp reversal from the longer-term pattern. This reflects slower earnings growth, higher macro uncertainty, repeated shocks and stronger demand for the so-called safe haven assets, like gold.
The data suggest a regime shift in the past decade rather than random variation: equity returns have become more volatile and episodic, while gold has delivered steadier relative performance (punctuated with its own negative annual returns) in the past decade.
Equity-dominant years: Strong Sensex outperformance appears in growth and recovery phases such as 2003–2007, 2009, 2012–2014, 2017 and 2021.
Gold-dominant years: Gold outperforms during stress, uncertainty or equity drawdowns, notably 2008, 2011, 2016, 2019–2020, 2022 and 2024–2025. Crisis years show extreme gold superiority, especially 2008 and 2011.
Past annualised returns
Past 3-year CAGR or compounded annual growth rate:
34.3% India gold price
13.3% BSE Sensex TRI return
Past 5-year CAGR:
21.6% India gold price
13.7% BSE Sensex TRI return
Past 10-year CAGR:
18.2% India gold price
14.0% BSE Sensex TRI return
Dividend yield as a contrarian signal:
The highest Sensex dividend yields (1999 figure is 4.13% and 2003 is 4.11%) coincided with periods of deep pessimism and depressed prices. The 2003 peak yield followed the 2002 multi-year Sensex lows, reinforcing dividend yield as a reliable contrarian indicator for long-term equity returns.
Mean reversion in equities:
Extremely high dividend yields have historically marked turning points rather than peaks. After 2003, Sensex delivered one of its strongest multi-year bull runs, highlighting how yield spikes reflect undervaluation, not structural weakness.
Recency bias
Recency bias is the tendency to assume that what has happened most recently will continue into the future, causing investors to chase recent winners and ignore long-term cycles.
In markets, recency bias often shows up as:
> Investors extrapolating recent returns far into the future
> Chasing assets that have just performed well
> Abandoning assets after periods of poor performance
Recency bias in Indian gold investors leads them to assume recent strong returns will continue in future, causing overexposure near cycle peaks; like Taleb’s "turkey problem," prolonged positive experience breeds false confidence until a sudden regime shift triggers an unexpected disappointment.
The Taleb Turkey Problem, from Nassim Nicholas Taleb's book "The Black Swan", illustrates how repeated positive experiences (a turkey being fed daily until Thanksgiving day) can lead to dangerously false confidence about future safety, making a sudden-but-catastrophic event (Thanksgiving) a massive, unexpected shock.
The lesson is that past consistency does not imply future safety, especially when rare but severe regime shifts are ignored.
Recency bias is one of the main reasons investors buy high, sell low and get wiped out when the cycle eventually and inevitably turns.
Sidenote: The Taleb Turkey Problem is similar to Chicken and Master Story as described by Bertrand Russell, British philosopher and mathematician of great repute. Source: Sophie’s World by Jostein Gaarder.
Key takeaway:
Timing leadership between Sensex and gold is difficult. Diversification, rather than switching based on short-term trends, is the dominant lesson from the data.
References and Data:
The Chicken and Master Story - Foreign Exchange Losses in India 06Nov2011
Forbes India gold price data (2000 to 2025)
IBJA Rates PDF 20Jan2026
Tweet thread 20Jan2026 (with IBJA Rates image - gold and silver prices)
Tweet 20Jan26 BSE indices (with two images of 40 years of Sensex price return as well as TRI returns)
Tweet 20Jan26 BSE Indices monthly dashboard
Chart showing Sensex yearly return (Total Return Index or TRI); India gold price yearly return and Sensex outperformance in percentage points: Calendar year wise data from 1999 to 2025 >
Click on the chart to view better >

Chart showing Sensex levels, Sensex yearly return (price return); India gold price and yearly return and Sensex outperformance in percentage points: Calendar year wise data from 1999 to 2025 >
Please click on the chart to view better >

Raw data > Sensex returns for 40 years from 1986 to 2025 > both price as well as TRI returns >


---------------------------
P.S.: Update dated 20Jan2026: India Gold Price Annual Return / India Gold Price (using Nippon India MF gold price) Calendar Year Return: Yearly return of domestic gold price vs USD gold price vs USD INR change vs Nifty 50 TRI:
Check blog 'Indian Economy Data Bank' for update 02Dec2025 with chart 90 for annual return of India gold price (using Nippon India MF gold price), world gold price and USD gain vs INR
Indian economy data bank: update 02Dec2025 with chart 89 - Sensex vs gold price (using Forbes India price)
See also Update 03Jan2026 with charts 162 and 163 of blog: Forex Data Bank (25-year data on USD gain vs INR -- both calendar year and financial year data)
Sensex versus gold price 29May2024 (data 2000 - 2024)
Understanding Real Sensex and Currency Debasement (only financial year wise Sensex and CPI inflation data from 1990 to 2024) 14Mar2024
Data Comparison
The data compares calendar-year returns of India gold (INR), USD gold, USD-INR currency movement and Nifty 50 total returns from 2010 to 2025.
It highlights how gold and equities alternate leadership, with currency playing a meaningful role in India gold returns.
Domestic price of gold outperformed Nifty 50 total return index (TRI) in seven of the past 10 years, with Nifty 50 outperforming only in 2017, 2021 and 2023.
Role of Currency (USD-INR): India gold returns often exceed USD gold returns due to rupee depreciation. Years like 2011, 2013, 2018 and 2022 show modest or negative USD gold returns turning into positive rupee gold returns mainly because of sharp rupee weakness.
Year 2025 stands out with exceptionally high gold returns (nearly 75 per cent) and severe Nifty 50 underperformance, signaling extreme risk-off conditions. In fact, Nifty 50 underperformance versus gold is a staggering 62.9 percentage points, the highest in the last 16 years.
Year 2021 is the opposite, where equities delivered strong gains while gold posted losses. Nifty 50 outperformance was 29.6 percentage points in 2021. Such regime shifts explain why diversification between gold and equities is effective over full cycles.
Past annualised returns
Past 3-year CAGR or compounded annual growth rate:
33.8% India gold price
33.4% International gold price
2.79% Dollar gain vs Rupee
14.3% Nifty 50 TRI return
Past 5-year CAGR:
21.5% India gold price
18.5% International gold price
4.24% Dollar gain vs Rupee
14.7% Nifty 50 TRI return
Past 10-year CAGR:
18.0% India gold price
15.5% International gold price
3.09% Dollar gain vs Rupee
14.0% Nifty 50 TRI return
Time for rebalancing?
Gold has delivered unusually strong returns in recent years, driven by global risk, central bank buying and rupee depreciation. After such phases, future returns tend to moderate.
Indian stocks, while not cheap, are coming off a period of relative underperformance versus gold (also against global peers), which historically improves their medium-term expected returns.
The recent decade favors diversification rather than single-asset dominance.
From a forward-looking, risk–return perspective, gold-heavy Indian investors should consider gradually reducing gold exposure and increasing Indian equities, may be in a phased and disciplined manner provided you believe in mean reversion logic.
The good old rebalancing approach works for investors.
Data: India gold price from Nippon Gold ETF BeES factsheet
USD INR exchange rate: RBI
Nifty 50 TRI: Nifty Indices
Chart showing domestic price of gold (using Nippon India MF gold price) vs dollar gold price vs Nifty 50 TRI and Nifty 50 outperformance >

---------------------------


---------------------------
Gold price behaviour in Dec2025:
Gold prices in India showed a clear upward trajectory through Dec2025. Starting near Rs 1.28 lakh per 10 gm in the first week of the month, prices consistently moved higher. The peak was recorded on 26Dec2025, with the PM price touching almost Rs 1.38 lakh per 10 gm, marking a decisive breakout above the October ATH.
The persistence of higher closes suggests strong underlying demand and firm global cues rather than short-term speculative spikes. However, 2026 may witness intermittent corrections or consolidation, but the dominant momentum continues to strongly favour gold and silver in global markets.
Silver price behaviour in Dec2025:
Silver outperformed gold on a percentage basis during Dec2025. From levels around Rs 1.74 lakh per kg at the start of the month, silver prices surged sharply, crossing Rs 2 lakh by mid-December and accelerating further in the final week.
The standout move came on 26Dec2025, when the AM price peaked at Rs 2.32 lakh per kg, the highest level on record. The sharp intra-month gains indicate heightened volatility and stronger momentum compared with gold.
Silver prices are highly volatile and can swing sharply in either direction. Recent highs do not guarantee future returns, so investors should consider their risk tolerance before taking exposure.
AM versus PM price dynamics
The data show that both metals experienced meaningful AM–PM divergences on several days, particularly during strong trend phases. For gold, PM prices often edged above AM prices during rally days, reflecting sustained buying through the trading session. In silver, however, volatility was more pronounced.
Drivers behind the December rally:
The Dec2025 rally was primarily driven by firm international gold and silver prices, which provided the base momentum. Rupee depreciation played a secondary but supportive role.
Comparison with Oct2025 ATH:
While Oct2025 marked the first major peak, Dec2025 prices decisively surpassed those levels rather than merely retesting them. This transition from volatility to sustained highs signals a structural shift rather than a temporary spike.
Excess liquidity and policy uncertainty — years of unconventional monetary policy (like, zoro interest rates, QE or quantitative easing and QT or quantitative tightening), shifting rate expectations and large fiscal interventions have distorted price discovery across asset classes worldwide.
Ongoing geopolitical tensions, supply-chain shifts, Trump tariffs and tantrums, and uneven global growth are creating unpredictable risks that keep prices volatile.
Speculative flows through ETFs, excess financialisation of markets, algorithmic trading and short-term capital are amplifying volatility, often driving prices beyond their fundamental values.
Previous tweet thread 27Oct2025 on record gold / silver prices
Peak gold / silver rates (India domestic prices) for select dates in Dec2025 >

P.S.: Update dated 02Dec2025: Check blog 'Indian Economy Data Bank' for update 02Dec2025 with chart 90 for annual return of India gold price (using Nippon India gold price), world gold price and USD gain vs INR
P.S.: Update dated 02Dec2025: Check blog 'Indian Economy Data Bank' for update 02Dec2025 with chart 89 for Sensex versus India Gold Price (using Forbes India gold price) - Annual return of Sensex compared to annual return India Gold Price

P.S.: Update dated 14Sep2025: Check blog 'Indian Economy Data Bank' for update 14Sep2025 with chart 76 for Sensex versus India gold price (using Forbes India gold price)
P.S.: Update dated 14Sep2025: Check blog 'Indian Economy Data Bank' for update 14Sep2025 with chart 74 for Sensex versus India gold price (using Nippon India gold price)
Table: Showing AUM of gold ETFs in India, India gold price (IGP), Gold BeES NAV (net asset value), USD-INR exchange rate, dollar gold price (DGP) and quarterly percentage growth rates of the respective values:
(please click on the image to view better)


P.S.: Update dated 02May2024 with info on quarterly growth rates as at close of 31Mar2024 >

P.S.: Update dated 15Jan2024 with info on quarterly growth rates as at close of 31Dec2023 >
In the fourth quarter of 2023, AUM of gold ETFs grew by 14.8 percent -- most of the growth can be attributed to growth in gold price during the Oct-Dec2023 quarter. Gold price in rupees rose by 9.6 percent; while it rose by 11.1 percent in dollar terms.
While rupee gold price grew by 9.6 percent, Gold BeES NAV rose by only 8.9 percent -- due to the fact that investor return is eaten away by high expense ratios of gold ETFs and tracking error (TE).
During the calendar year 2023, gold ETF asset growth is at 27.4 percent driven by growth in gold price by 15.3 percent in rupee terms (gold price rose by 13.2 percent in dollar terms), but Gold BeES NAV growth was only 12.7 percent -- due to high expense ratio of ETFs and tracking error.
Between Dec2017 and Dec2023, gold price in rupees grew by 120 percent, while the NAV of Gold BeES grew by 103 percent -- a loss of almost 17 percent for gold ETF investors due to high expense ratios and tracking error.


P.S.: Update dated 16Oct2023 with info on quarterly growth rates as at close of 30Sep2023 >
Year-to-date (that is, between end-Dec2022 and end-Sep2023), gold price in USD rose by just 2 percent, though gold price in INR moved up by 5.2 percent as INR depreciated against the USD. In the same period, AUM of gold ETFs increased by 10.9 percent. Despite the fears of a recession in the US and Europe and concerns surrounding Russia-Ukraine war, gold has not done well this year.

P.S.: Update dated 30Apr2023 with info on quarterly growth rates as at close of 31Mar2023 >
In the past three months (between 31Dec2022 and 31Mar2023), AUM of gold ETFs rose by 6.0 percent, as investors seem to be optimistic about gold as gold price in dollar rose by 8.6 percent during the first quarter of 2023. Against the increase of 8.6 percent in dollar gold price, NAV of Gold BeES rose by only 7.4 percent during the period.

P.S.: Update dated 13Jan2023 with yearly growth rates between Dec2017 and Dec2022 >
The below yearly growth chart shows how the metrics relating to gold ETF, gold price and USD-INR exchange rate have moved over the past five years, that is, between end of 2017 and end-2022.
Between 2017 and 2022, assets of gold ETFs grew by 342% (CAGR is 34.6%). Gold price in rupees rose by 90.8%, with a CAGR of 13.8%.
Interestingly, the net asset value (NAV) of Gold BeES ETF grew by 79.8% (CAGR 12.5%) -- which has failed to keep up with the 90.8% (CAGR 13.8%) rise in Indian gold price. This means, investors in gold ETF products will be unable to match the rise in gold prices -- the gold ETF returns are eaten by mutual fund expenses.
In addition, the chart provides yearly (calendar year) growth rates of these metrics. For example, assets of gold ETFs grew by 16.6% in 2022, whereas dollar gold price changed barely in the same period. In the past five years, the biggest growth in gold ETF assets occurred in 2020, with a growth of 146% -- driven mainly by rise in gold prices.
(please click on the image to view better)

P.S.: Update dated 13Jan2023 with info on quarterly growth rates as at close of 31Dec2022 >
In the past 12 months or year-to-date (between end-Dec2021 and end-Dec2022), assets of Gold ETFs grew by 16.6 percent. YTD, India gold price (IGP) rose by 14.1 percent, though dollar gold price (DGP) remained flat in the same period -- the rise in IGP is accounted for by the fact that the US dollar gained 11.2 percent versus Indian rupee in 2022.
The NAV of Gold BeES rose by 14 percent versus the 14.1 percent growth of IGP.
(please click on the image to view better)
P.S.: Update dated 23Oct2022 with new images with info as at close of 30Sep2022 >
In the past nine months or year-to-date (between end-Dec2021 and end-Sep2022), assets of Gold ETFs grew by 7.9 percent.
YTD, rupee gold price rose by 4.6 percent, though the dollar gold price fell by 8.9 percent. Why is that so? Because Indian rupee depreciated against the US dollar by 8.8 percent, pushing up the rupee gold price.
YTD, dollar gold price fell by 8.9 percent.
YTD, gold ETF net asset value (NAV) rose by only 3.9 percent though the rupee gold price rose by 4.6 percent. Why so? Because gold ETF returns are reduced by expenses charged by the mutual fund company.

P.S.: Update dated 08Jul2022 with new images with info as at close of 30Jun2022 >
In the past seven quarters, investors have practically got no returns from gold (in terms of gold price in India). The US dollar's appreciation against the Indian rupee by 7.0 per cent (between Sep2020 and Jun2022), nullified the effect of dollar gold price, which fell by 6 per cent during the same period--the net effect is a gain of just 0.8 per cent in rupee gold price. Ironically, investors continue to pump in more money into gold ETFs in India with the gold ETF AUM rising by almost 50 per cent in the past seven quarters.

- - -
References:
List of gold ETFs on NSE with their trading volumes and prices
Tweet 12Dec2020 - gold ETFs and high expense ratios
Tweet 12Dec2020 - gold valuation - gold ETF SID
Tweet 26Feb2020 - RBI manipulation of exchange rate
AMFI monthly data
RBI data DBIE - HBIE - Table 162 / Monthly price of gold and silver in domestic and foreign markets
IBJA Bullion rate - IBJA rates gold for past 60 days
Disclosure: I've vested interested in Indian stocks and other investments. It's safe to assume I've interest in the financial instruments / products discussed, if any.
Disclaimer: The analysis and opinion provided here are only for information purposes and should not be construed as investment advice. Investors should consult their own financial advisers before making any investments. The author is a CFA Charterholder with a vested interest in financial markets.
CFA Charter credentials - CFA Member Profile
CFA Badge
He blogs at:
https://ramakrishnavadlamudi.blogspot.com/
Twitter @vrk100
No comments:
Post a Comment