BSE 500 versus S&P 500 Indices 31Dec2021
Follow @vrk100
(update 11Jan2023 with info as of 31Dec2022 is available here)
Indian investors have of late been attracted by global stocks, especially those in the US. Some smart investors go through the route of direct investments. Others have chosen the path of mutual funds.
The advantage of mutual funds is one can start small and grow their investment corpus over a period of years, without the hassle of worrying about the performance of individual stocks.
The Indian investor's interest in global mutual fund schemes can be gauged from the increase in asset size of the funds with exposure to international stocks (global stocks other than Indian ones).
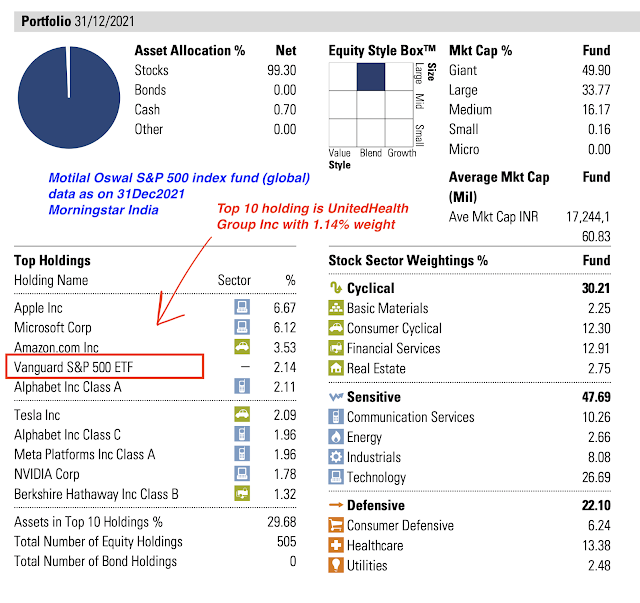
For example, Motilal Oswal S&P 500 Index fund has an asset size of more than Rs 2,700 crore, even though it was launched less than two years back. Another fund, ICICI Prudential US Bluechip Equity Fund has an asset size of Rs 2,000 crore.
There are other funds with exposure to non-US stocks in the Asian nations, such as, China, Taiwan and Japan.
-------------------
Read more:
Who is Eating my Gold ETF Return?
NSE Indices Comparison
Foreign Investors Waning Interest in Indian Stocks
RBI Bought 200 tonnes of Gold
7 Reasons why Gold Monetization Scheme will be a failure
FPI Flows into Indian Stock Market
Indian Equity ETF Risks and Returns
Modi Rally, Recency Bias and Stock Market Returns
Indian Mutual Funds and The Art of Ripping Off Investors
Do Paint Stocks and Crude Oil Tango?
Weblinks and Investing-------------------
Though the structure and composition of the Indian and US stocks markets are different, there is strong correlation of returns between the US stocks, as represented by the S&P 500 index and the Indian stocks represented by BSE 500 index. Financial markets across the globe are closely connected.
A brief analysis is made to examine the differences and similarities between these two indices, namely, BSE 500 and S&P 500. All the data are as of 31st of December 2021.
Fundamentals:
Table 1: Risks, Returns and Valuation parameters >
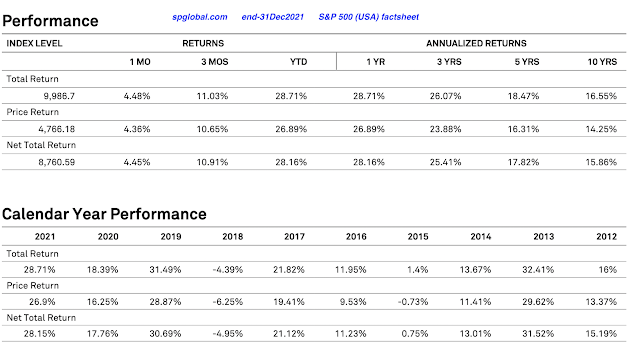
On a one-year and 10-year basis, BSE 500 index has outperformed the S&P 500 index. But on a 3-year and 5-year basis, S&P 500 has attained superior returns. Here, total returns including dividends are considered.
When you take risk measure standard deviation, S&P 500 index has done better than BSE 500 for the three-, five- and 10-year periods. The lower the standard deviation, the better the index from a risk mitigation perspective.
As the S&P 500 has lower standard deviation, Sharpe ratio for S&P 500 index is superior for all the three time periods shown the exhibit above. Sharpe ratio is a measure that indicates an investment return adjusted for risk.
Investments with higher Sharpe ratios are considered as providing superior risk-adjusted returns.
Top 10 Stocks:
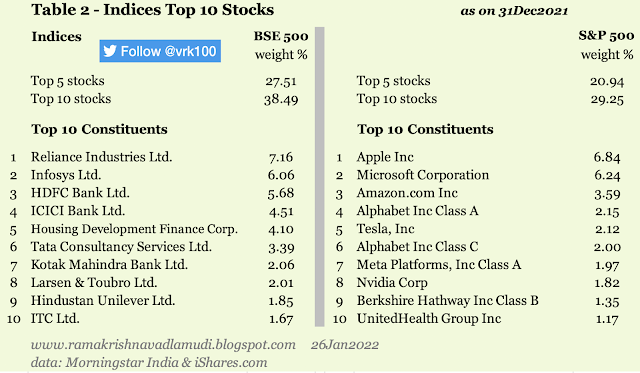
Table 2: Top 10 stocks and Concentration Risk >
As Table 2 shows, concentration risk for BSE 500 is considerably higher as compared to S&P 500. Top 5 and 10 stocks have a total weighting of 27.5 per cent and 38.5 per cent respectively in BSE 500; whereas the values are just 20.9 and 29.3 per cent for S&P 500 index.
The top five components in the S&P 500 are from the so-called Big-Tech sector in the US, namely, Apple, Microsoft, Amazon, Google and Tesla. Whereas, the top five stocks in BSE 500 belong to Energy, Software and financial services sectors--they are Reliance Industries, Infosys, HDFC Bank, ICICI Bank and HDFC Ltd.
BSE 500 has 501 holdings, whereas S&P 500 has 505 holdings.
Top 10 Sectors:
Table 3: Top 5 Sectors and Concentration Risk >
The third exhibit gives a different picture as regards the concentration risk. Based on the top 5 and 10 stocks, we've concluded that concentration risk is hither for BSE 500 (Table 2 above). But concentration risk appears to be higher for S&P 500 when you look at the weightings of top sectors in the index.
Top 3 and 5 sectors have total weighting of 55 and 76 per cent respectively in S&P 500. But in BSE 500, their weights are lower at 54 and 72 per cent respectively.
Only Financial Services is present among top three sectors of the two indices. Technology sector stocks dominate S&P 500, whereas BSE 500 is dominated by Financial Services stocks, like, banks, finance and insurance companies.
Healthcare sector's exposure in S&P 500 is more than double that of it in BSE 500. BSE 500 has more than 10 per cent exposure to materials sector, but S&P 500's exposure is just 2.60 per cent. Energy has higher weighting in BSE 500.
Overall, BSE 500 tends to be dominated by old economy stocks, whereas S&P 500 is dominated by Big-Tech, new-age and innovative segments of the economy.
Of course, it is expected that Indian indices too will increasingly lean toward new-age and innovation-led companies. It takes a lot of time and effort on the part of Indian entrepreneurs--with sensible rule of law, better business practices and solid infrastructure.
Conclusion
Investors tend to suffer from home bias, the tendency of investors to restrict their stock universe to domestic equities avoiding exposure to stocks outside their nation.
From a diversification and risk management perspective, it is generally better for domestic investors to have some exposure to international stocks and correct their home bias.
Mutual fund are excellent vehicles for early and novice investors. Increasing awareness of the benefits of international diversification has allowed Indian investors (especially those exposed to US stocks) to benefit from the non-domestic exposure.
Not many can stomach the gut-wrenching volatility inherent in the financial markets. We need to train our minds towards long term orientation, compounding benefits and unwavering attitude.
This is a not a recommendation. This is a little attempt to bring the characteristics and nuances involved in the construction and composition of the indices to my readers. This is just for educational purpose, some kind of an education for the author himself!
- - -
P.S. 1: Expense ratios of ICICI Prudential BSE 500 ETF and that of Motilal Oswal Nifty 500 Index fund are 0.29% and 0.39% respectively. Whereas iShares Core S&P 500 ETF and SPDR S&P 500 ETF Trust have expense ratios of 0.03 and 0.09 per cent respectively.
P.S. 2: I've looked at the top 10 stocks and sectors of the BSE 500 and Nifty 500 indices. Both are strikingly similar in terms of stock / sector concentration, large-, mid- and small-cap weights and other broader parameters. There is practically no difference between the composition of BSE 500 and Nifty 500 indices.
References:
My Blog 15Jan2022 - India Equity ETF Risks and Returns - this blog contains 55 images / screenshots with lots of data for several years
S&P Dow Jones Indices - S&P 500 and other US indices monthly factsheets, index methodology and others
S&P Dow Jones Indices - BSE 500 and other BSE indices monthly factsheets, index methodology and others
BSE 500 index monthly factsheet - S&P Global
S&P 500 index monthly factsheet - S&P Global
ICICI Pru BSE 500 ETF - Morningstar India
iShares Core S&P 500 ETF - monthly factsheet
Nifty 500, BSE 500 and S&P 500 compare - M
Nifty 500, BSE 500 and S&P 500 compare - V
Tweet thread 07Jun2021 - compare funds / ETFs - BSE 500 ETF, concentration risk, etc.
Three Tweets 20May2021 - one, two and three - data 30Apr2021
Tweet 20May2021 - Compare funds / ETFs based on broad-based indices
Tweet thread 05Jan2021 - Nifty 50, Nifty 100, Nifty 500 and Nifty Next 50 indices 31Dec2020 data >
Tweet 08Sep2020 - data 31Aug2020 - Compare funds / ETFs based on broad-based indices
Tweet 01Sep2019 - compare funds / ETFs based on Broad indices, like, Nifty 50, Nifty Next 50 (Junior Nifty), etc.
Tweet 02Aug2019 - Compare funds / ETFs based on broad-based indices
Tweet thread 15Oct2018 - Compare funds / ETFs based on broad-based indices
My Tweet 17Apr2021 - BSE 500 vs S&P 500
My Tweet 17Apr2021 - BSE 500 vs S&P 500 concentration risk
My Tweet 30Jun2019 - Dual class shares (US) - Harvard paper
My Tweet 30Jun2019 - Class A shares of Google (Alphabet)
My Tweet 31Aug2018 - GICS sectors - Global Industry Classification Sector
Raw data from Morningstar India, S&P Global (S&P Dow Jones Indices) and iShares (all the images have data as of 31Dec2021) >
Disclosure: I've vested interested in Indian stocks and other investments. It's safe to assume I've interest in the financial instruments / products discussed, if any.
Disclaimer: The analysis and opinion provided here are only for information purposes and should not be construed as investment advice. Investors should consult their own financial advisers before making any investments. The author is a CFA Charterholder with a vested interest in financial markets.
CFA Charter credentials - CFA Member Profile
CFA Badge
He blogs at:
https://ramakrishnavadlamudi.blogspot.com/
Twitter @vrk100


No comments:
Post a Comment