Friday, 10 December 2021

Savers' Curse: Low Savings Rates and Liquid Mutual Fund Returns - vrk100 - 10Dec2021

Savers' Curse: Low Savings Rates and Liquid Mutual Fund Returns


(Updates with new information as of 31Jan2023, 30Sep22, 30Jun22, 30Apr22 and 31Jan22 are available at the end of this article)


Globally, savers have been getting a raw deal in the hands of central banks and governments. Even though inflation across the major nations has been running very high, central banks in these nations have been keeping interest rates ultra low, jeopardising the interests of savers.

Since the advent of petrodollars and sovereign wealth funds in the 1970s, savings glut has been bedeviling the global economy for decades. Major developed nations currently have either zero interest rates or negative interest rates, like in Switzerland, Denmark and Japan.

The ultra-low interest rates have been artificially inflating the prices of risky assets (like, stocks, commodities, crypto assets and real estate) is a different issue. A narrow set of investors who have exposure to such risky assets have benefited immensely in the past few decades. 

-------------------

Read more:

Indian Mutual Funds and The Art of Ripping Off Investors

India Second Quarter GDP 

Global bond yields and Interest rates

Do Paint Stocks and Crude Oil Tango?

BSE Broad and Sectoral Indices Returns

Real Estate Stocks and REITs

When Will Federal Reserve Raise Interest Rates?

Weblinks and Investing

-------------------

As argued by former Federal Reserve chair Alan Greenspan (note 1), the excess in savings is a result of globalisation, technology driving prices lower and ultra-loose monetary policies of major central banks.

It's no wonder people have been currently experiencing negative real interest rates (nominal rates adjusted for inflation) the world over. Twentieth century's great economist John Maynard Keynes described inflation and economic instability as the enemies of civilisation. Unfortunately, nobody seems to be in a mood to recall his wise words.

India is no exception to these forces. A major shift in India's interest rate policy occurred at the turn of the twenty-first century when the then Vajpayee government started reducing interest rates drastically taking advantage of low inflation--ultimately stimulating the investment demand in the country between 2003 and 2008. 

Now, India is in a kind of a quandary as far as interest rates are concerned. India's central bank, the Reserve Bank of India, has been maintaining a benign interest rate policy ever since Mr Shaktikanta Das took over as RBI governor in December 2018. 

India's benchmark inflation, consumer price inflation (CPI) has been running very high since of end of 2019. The COVID-19 outbreak in March 2020 complicated matters for the RBI. It was forced to cut interest rates  in order to revive the economy struck by the Pandemic and the self-infected draconian nation-wide lockdowns between March and July 2020. 

Even as CPI inflation has been running above the comfort zone of 5 to 6 per cent (see chart 3 below), RBI has been maintaining its low interest rate policy to stimulate the economy. Recent data suggest many of the macro indicators seem to be giving healthy signs of recovery. 

The low interest rates combined with negative real yields have eroded the purchasing power of savers, especially impacting retired people and those in lower strata. That the government has kept the small savings interest rates (Post Office schemes) unchanged is a small relief. 

Even the market-related instruments, like, liquid mutual funds have failed to provide any relief to market-savvy investors. During 2013 and 2014, they used to offer 9 per cent return annually--and their returns have progressively decreased to 8 per cent by 2015, 6 per cent by 2019 and to a shockingly low of 4 per cent last year (chart 1 below). 

The past one-year return for liquid mutual fund is just 3.2 per cent! (Mind you, actual inflation suffered by Indians is north of 6 to 7 per cent -- official inflation data are largely fudged).


As Chart 2 below reveals,the monthly returns provided by liquid funds improved to 0.30 per cent (not annualised) from 0.25 per cent a few months ago. This is mainly due to the fact that the Treasury bill rates have improved in recent months with the 364-day Treasury bill yield moving above 4 per cent lately.

However, this is no consolation for the saving community.

Chart 2: Liquid mutual funds returns (monthly returns - not annualised):


Chart 3: Negative real interest rates (repo rate minus inflation) > 


Summing Up

Savers in India have suffered for too long a time. There are not many safer instruments that protect against runaway inflation. The low interest rates have been forcing some people to dabble in outright speculation which may not be healthy in the long run.

It's time the Indian government and the RBI recognised the savers' curse and took important measures to alleviate the concerns of savers.

- - -


Additional data:


Update 23Feb2023: Liquid mutual fund returns: Data from Feb2022 to Jan2023  >

Value Research data link 

As RBI has been raising its policy repo rate, short term interest rates have spiked up reflecting in the improvement in liquid mutual fund returns. As on 22Feb2023, one-year liquid returns are fetching around 5.32 percent (direct plans). 


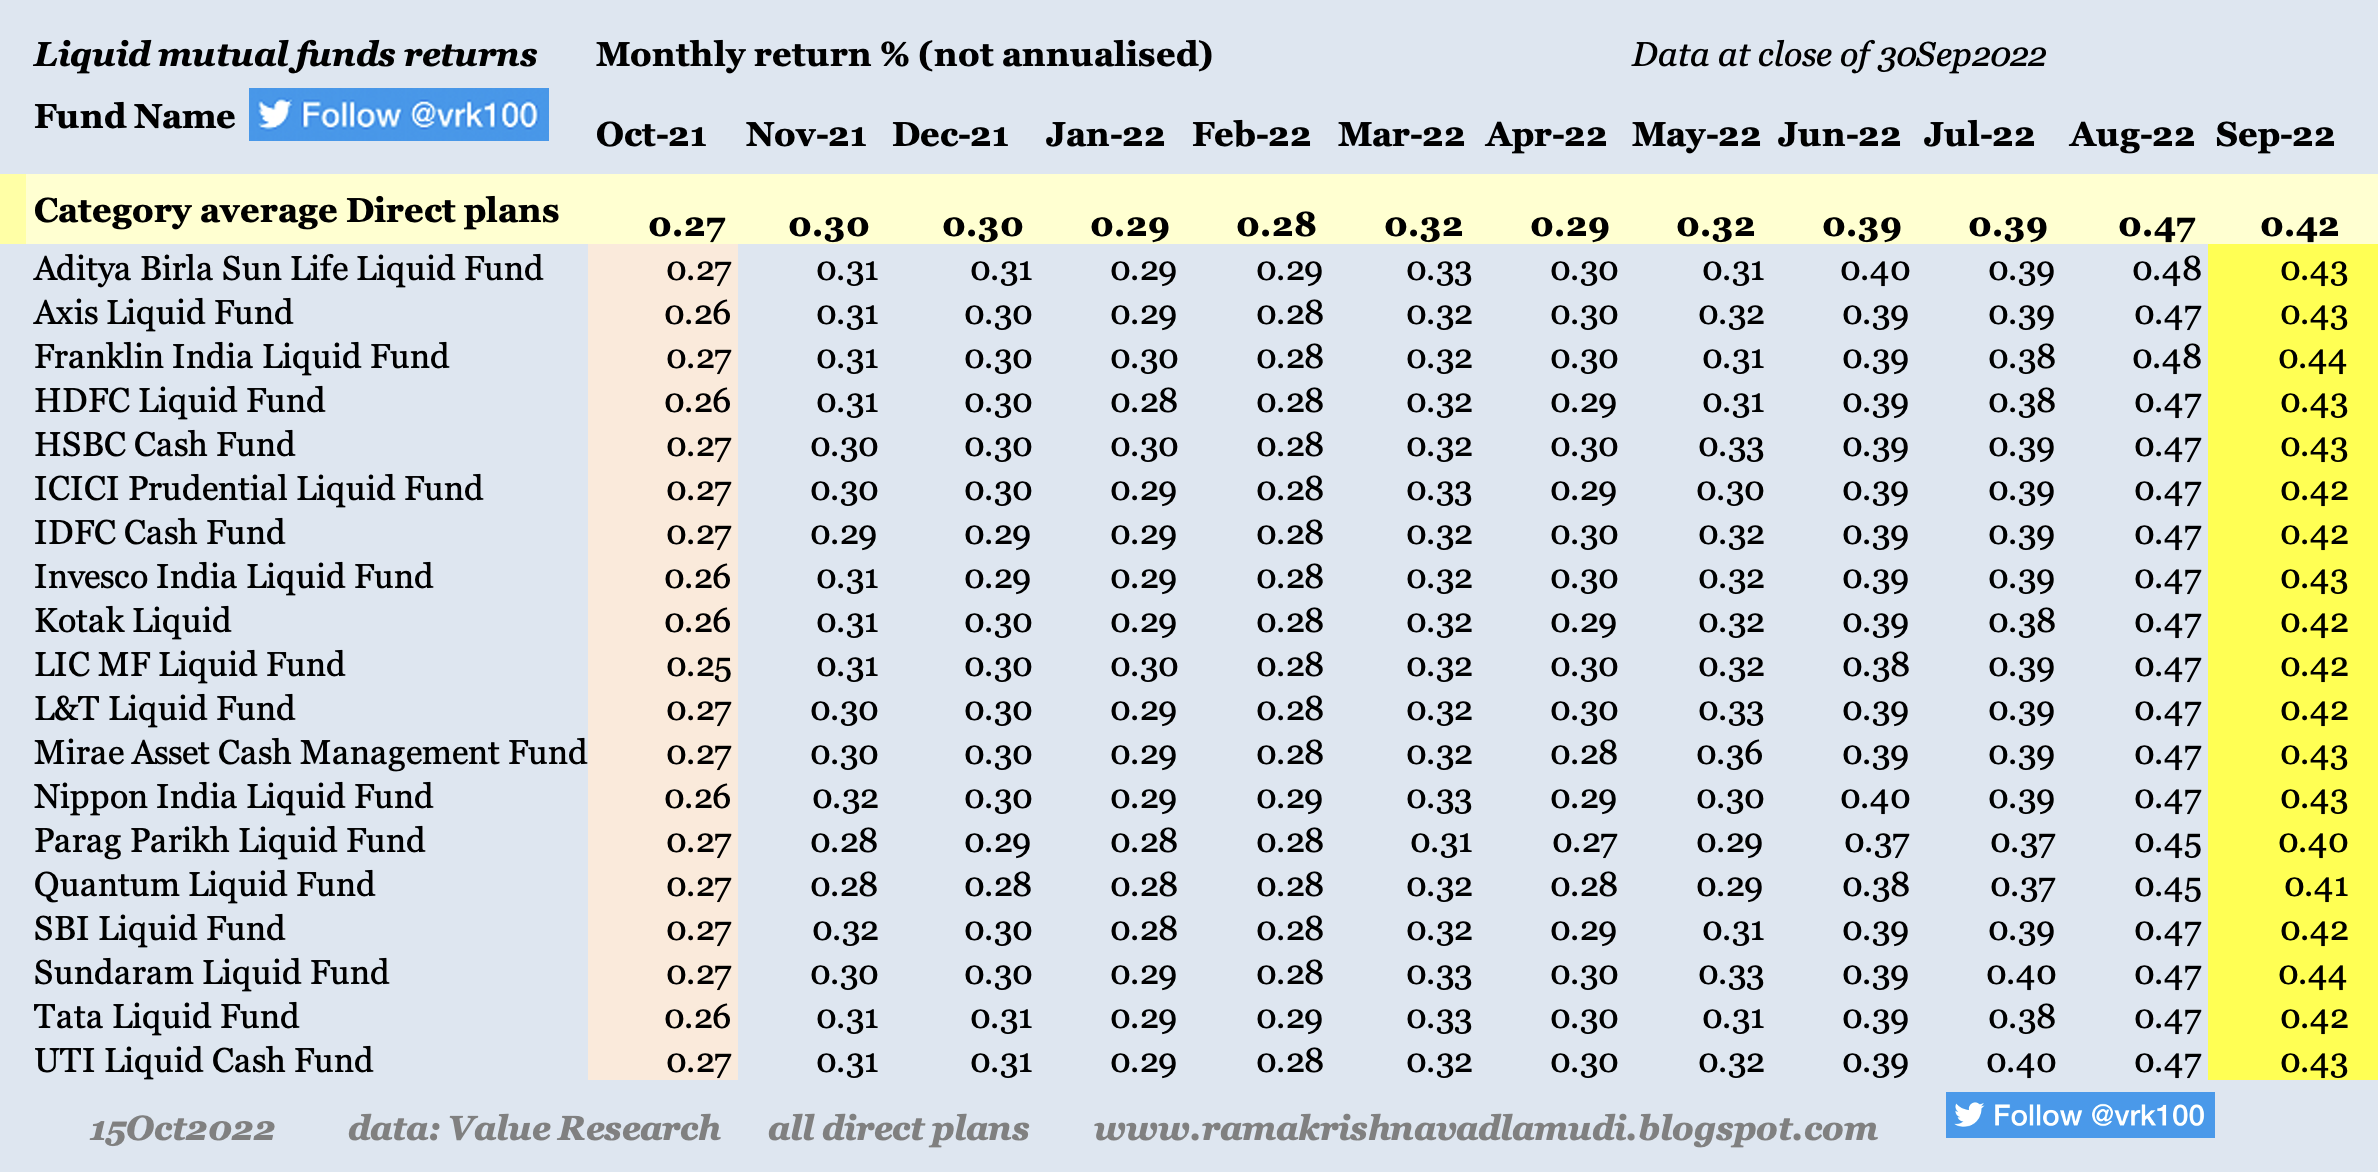
Update 15Oct2022: Liquid mutual fund returns: Data from Oct2021 to Sep2022  >

Value Research data link 

As short term interest rates (like call money rate, Treasury Bill rates, etc.) have shot up in the economy in the past three to six months, there is an improvement in liquid mutual fund returns now. One-year liquid fund return fetched 3.20 percent  back in Dec2021 and now they are quoting at around 4.10 percent (direct plans of liquid funds). 

But the liquid fund returns are much lower than 364-day Treasury Bill rate, which is around 7.00 percent a few days back and current call money rates of 6.15 percent. Even bank fixed deposit interest rates have improved in recent months.


Update 14Jul2022: Liquid mutual fund returns: Data from Jul2021 to Jun2022  > 

There is a sharp spike in liquid MF returns in the month of June 2022 to 0.39 percent from 0.32 percent in May2022, driven by rising interest rates in India >


Update 19May2022: Liquid mutual fund returns: Data from May2021 to Apr2022  >   


Update 01Feb2022: Liquid mutual fund returns: Data from Feb2021 to Jan2022  >  


References:

Note 1: "The Age of Turbulence: Adventures in a New World" By Alan Greenspan

Scribd Sovereign Wealth Funds 25Oct2007

Value Research liquid mutual funds returns

my tweet 05Jun2021 liquid funds


my tweet 04Feb2021 liquid funds


- - -

Disclosure:  I've vested interested in Indian stocks and other investments. It's safe to assume I've interest in the financial products discussed, if any.

Disclaimer: The analysis and opinion provided here are only for information purposes and should not be construed as investment advice. Investors should consult their own financial advisers before making any investments. The author is a CFA Charterholder with a vested interest in financial markets. 

CFA Charter credentials  - CFA Member Profile

CFA Badge


He blogs at:

https://ramakrishnavadlamudi.blogspot.com/

https://www.scribd.com/vrk100

Twitter @vrk100 


Tuesday, 7 December 2021

Indian Mutual Funds and The Art of Ripping Off Investors - vrk100 - 07Dec2021

Indian Mutual Funds and The Art of Ripping Off Investors


Mutual funds are supposed to act in the best interest of their investors. That mutual funds fail in their fiduciary duty is a well-established fact for more than 50 years. 

Indian mutual funds are no different from their global peers. As well-telegraphed in SPIVA reports, more than 80 per cent of equity funds routinely underperform the index returns. 

Compared to their global peers, the expense ratios of equity funds in India are very high. One reason for this divergence is that the size of Indian mutual fund industry is smaller versus their US and European peers. 

Regular plans of Indian equity mutual funds have higher expense ratios as compared to direct plans. Regular plans have the benefit of financial advice. Investors who have financial knowledge invest in direct plans of mutual funds, avoiding the advisors and higher fees.


-------------------

Read more:

Savers' Curse and Low Savings Rate and Liquid Fund Returns

India Second Quarter GDP 

Global bond yields and Interest rates

Do Paint Stocks and Crude Oil Tango?

BSE Broad and Sectoral Indices Returns

Real Estate Stocks and REITs

When Will Federal Reserve Raise Interest Rates?

Weblinks and Investing

-------------------


It is almost nine years since the introduction of direct plans in India. Investors have access to direct plans since the beginning of January  2013. Due to compounding effect, investors who invest in regular plans lose heavily in comparison to direct plan investors. 

Imagine the fate of regular plan investors who invest for periods of 20 or 25 years--their losses would be humongous due to the power of compounding!  

This fact was brought out by me in a tweet thread a few years ago. Still, there is a lot of ignorance among gullible investors about the loss they suffer due to high expense ratios, especially in regular plans.

I've taken a fresh look at the net asset values (NAV) of 15 randomly chosen equity mutual funds and compared how much regular plan investors have lost in the past nine years or so.


Table 1: Nine-year data showing the returns of direct and regular plans since Jan2013 (please click on the image for a better view):


As can be seen clearly from the above table, the loss suffered by regular plan investors is between 6.7 per cent and 14.6 per cent in the past nine years, in these 15 equity mutual fund plans.

For example, the NAV of Invesco India Mid-cap fund as on 01Jan2013 was Rs 17.70, which was the same for direct and regular plans. As on 06Dec2021, the NAV of the fund's direct plan grew to Rs 99.35, whereas the NAV of regular plan grew to just Rs 86.67--which means, the direct plan delivered a superior return of 460 per cent vs regular plan's return of just 390 per cent. 

Put differently, as a regular plan investor you would've lost about 14 per cent of the money generated by a direct plan investor. Suppose, you had on 01Jan2013 invested Rs 500,000 in the regular plan of Invesco India Mid-cap fund at the the NAV of Rs 17.65. As on 06Dec2021, your initial investment would have grown to Rs 24,55,200.

On the other hand, your friend invested Rs 500,000 in the same fund and on the same date but in the direct plan, her money would have grown to Rs 28,04,900 as on 06Dec2021. Her direct plan investment would have generated excess return of Rs 349,700 or 14 per cent over and above your maturity amount. 

In the case of SBI Small cap, JM Tax gain and Canara Robeco Consumer Trends funds, the direct plan investors would have generated nearly 10 per cent more than the return generated by regular plan investors (please check the above table).

As a regular investor, you're losing on two fronts--on the one hand, active fund managers have been failing to generate superior returns (versus passive funds, such as, index funds and exchange-traded funds or ETFs) and on the other hand, you're getting ripped off due to higher expense ratios. 

It's better to learn more about the basics of mutual funds and build up your competence and beware of the shenanigans of the asset mustering companies (aka AMCs), who have been pulling wool over gullible investors for long.


- - -

References:

My tweet thread 22Jan2018 dated on Direct vs Regular plans

Point-2-Point (P2P) returns of mutual funds - Value Research

advisorkhoj historical NAV of mutual funds

SPIVA reports - S&P Indices Versus Active reports


Disclosure:  I've vested interested in Indian stocks. It's safe to assume I've interest in the stocks discussed, if any.

Disclaimer: The analysis and opinion provided here are only for information purposes and should not be construed as investment advice. Investors should consult their own financial advisers before making any investments. The author is a CFA Charterholder with a vested interest in financial markets. He blogs at:

http://scribd.com/vrk100

Twitter @vrk100    


Friday, 3 December 2021

Update - Bank Disintermediation and Flow of Resources to Commercial Sector - vrk100 - 03Dec2021

Update - Bank Disintermediation and Flow of Resources to Commercial Sector


This is an update of my article 'Bank Disintermediation and Flow of Resources to Private Sector' dated 26Sep2020:


The corporate sector and households in India raise resources from a variety of sources. Due to bank disintermediation, the commercial sector in India has got a slew of sources to raise monies from. 

The commercial sector has diversified its sources of finance to non-banking finance companies (NBFCs), stock market, rights issues, private placement and foreign sources like external commercial borrowings (ECBs) and foreign direct investment (FDI).

-------------------

Read more:

India Second Quarter GDP 

Global bond yields and Interest rates

Do Paint Stocks and Crude Oil Tango?

BSE Broad and Sectoral Indices Returns

Real Estate Stocks and REITs

When Will Federal Reserve Raise Interest Rates? 

The Central Triad in Taleb's Antifragile

Weblinks and Investing

-------------------


Those interested for a detailed analysis of bank disintermediation and flow of private sector resources may refer to my article written in 2020.  

In this article, I'm providing just an update with data available up to financial year 2020-21.

Chart providing data from 2014-15 to 2020-21 (click on the image for larger picture) >


During 2020-21, the money flow to the commercial sector increased by 11.8 per cent to Rs 16.97 lakh crore (Rs 15.17 lakh crore in 2019-20), showing an absolute growth of Rs 1.80 lakh crore -- of which major growth is from commercial paper issued by non-banks (row B1 iii), credit from NBFCs and accommodation by all-India financial institutions, such as, NABARD, NHB, etc.

Interestingly, money raised from ECBs is almost nil in 2020-21, while growth in FDI is just Rs 10,000 crore. The share of foreign sources fell to 22 per cent of the total flow in 2020-21 from 36 per cent in 2019-20.

As can be gleaned from the above table, the private sector's reliance on bank credit has come down from 42.9 per cent in 2014-15 to 33.7 per cent in 2020-21, as per data from Reserve Bank of India (RBI). The share of bank credit in total resources fluctuated between 34 per cent and 52 per cent of total flow in the past six years.

The media often highlight the fact that bank credit growth is tepid, as if it is the only source of funding for the commercial sector. As we've seen, the importance of bank credit for the growth of commercial sector in India has come down drastically over the years and as such you may correct the ignorant media above this.

- - -

References:

RBI Handbook of Statistics on Indian Economy 15Sep2021

Table 65: Flow of Resources to the Commercial Sector in India

My tweet dt 26Sep2020 on Flow of Resources to the Commercial Sector

My tweet dt 15Sep2018 on Flow of Resources to the Commercial Sector

RBI Mint Street memo dated 03Jan2018 Credit Disintermediation from Banks - Has the Corporate Bond Market Come of Age?


Disclosure:  I've vested interested in Indian stocks. It's safe to assume I've interest in the stocks discussed, if any.

Disclaimer: The analysis and opinion provided here are only for information purposes and should not be construed as investment advice. Investors should consult their own financial advisers before making any investments. The author is a CFA Charterholder with a vested interest in financial markets. He blogs at:

http://scribd.com/vrk100

Twitter @vrk100    

Tuesday, 30 November 2021

India Second Quarter GDP FY 2021-22 - vrk100 - 30Nov2021

India Second Quarter GDP FY 2021-22


Government of India today announced GDP (gross domestic product or annual income) estimates for the second quarter of financial year 2021-22. The real GDP (at constant prices) for the second quarter is Rs 35.73 lakh crore, showing a growth of 8.4 per cent as compared to the second quarter of FY 2020-21.


-------------------

Read more:

Global bond yields and Interest rates

Do Paint Stocks and Crude Oil Tango?

BSE Broad and Sectoral Indices Returns

Real Estate Stocks and REITs

When Will Federal Reserve Raise Interest Rates? 

The Central Triad in Taleb's Antifragile

Weblinks and Investing

-------------------


It is worth noting that India's real GDP for second quarter of FY 2021-22 is Rs 35,73,451 crore as compared to second quarter real GDP of FY 2019-20 of Rs 35,61,530 crore--which amounts to practically zero growth in the past two years.

It may be noted that the real GDP in Q1 and Q2 of FY 2020-21 contracted by 24.4 per cent and 7.4 per cent respectively due to the draconian lockdown, during March-June 2020, imposed by the Prime Minister Modi government after the outbreak of COVID-19 pandemic.

Table 1 - Real GDP (click on the image for a better view): 


As can be gleaned from the above table, India's national income has not grown at all in the past two years. Even before the Pandemic, India's GDP growth rate had been decelerating due to the failure of the economic polices of the current central government.  

It's disconcerting to note that India's per capita income, as per World Bank estimates, is USD 1,950, which is below that of Bangladesh.

Table 2 - GDP at current prices (click on the image for a better view): 


Nominal GDP for the second quarter of FY 2021-22 is Rs 55.54 lakh crore, showing a growth of 17.5 per cent versus second quarter GDP of FY 2020-21. Nominal GDP recorded a contraction of 4.4 per cent in second quarter of FY 2020-21 amidst the Pandemic. 

Nominal GDP growth of 17.5 per cent for the latest quarter is driven by inflationary pressures in the Indian economy that have been building up since November 2019.

For October 2021, India's consumer price inflation (CPI) is 4.48 per cent and wholesale price inflation (WPI) is 12.54 per cent. It's an irony during and after the Pandemic that corporates and other businesses have achieved pricing power (as reflected in the steep WPI inflation rate) even though there is demand destruction domestically caused mainly by the COVID-19 deaths, loss of livelihoods in the informal sector and the supply chain bottlenecks globally. 

It is hoped the momentum in the Indian economy will continue to hold at least in the next two quarters, despite the deep concerns about the new Omicron variant, which is declared as a variant of concern (VOC) by the World Health Organisation (WHO).

India CPI and WPI inflation figures >


- - -

Note: India's financial year starts from April to March of every year. Traditionally, India quarterly GDP figures are compared year-on-year (in contrast to the US where they are compared quarter-on-quarter).

References:  

MOSPI press note dated 30Nov2021

Trading Economics: India CPI inflation rate

Trading Economics: India WPI inflation rate

Abbreviations used:

GDP - gross domestic product

USD - US dollar


Disclosure:  I've vested interested in Indian stocks and other investments. It's safe to assume I've interest in the financial products discussed, if any.

Disclaimer: The analysis and opinion provided here are only for information purposes and should not be construed as investment advice. Investors should consult their own financial advisers before making any investments. The author is a CFA Charterholder with a vested interest in financial markets. 

CFA Charter credentials  - CFA Member Profile

CFA Badge


He blogs at:

https://ramakrishnavadlamudi.blogspot.com/

https://www.scribd.com/vrk100

Twitter @vrk100

Monday, 29 November 2021

Global Bond Yields and Interest Rates - vrk100 - 29Nov2021

Global Bond Yields and Interest Rates


(Please see updates for this blog: update 07Jul2022 and update 05Mar2022)


Major central banks globally have been following ultra loose monetary policies, by keeping interest rates artificially lower even though inflationary pressures have been building up considerably since the beginning of 2021.

In normal times, central banks would have raised interest rates to keep inflationary expectations and rising inflation in check. But most of the major central banks, like, the US Federal Reserve, Bank of England, the European Central Bank, Reserve Bank of Australia and Reserve Bank of India, have kept their interest rates unchanged in 2021.


-------------------

Read more:

Do Paint Stocks and Crude Oil Tango?

BSE Broad and Sectoral Indices Returns

Real Estate Stocks and REITs

When Will Federal Reserve Raise Interest Rates? 

The Central Triad in Taleb's Antifragile

Weblinks and Investing

-------------------


These central bankers have been arguing that the current inflation is transitory, buoyed by broken global supply chain mechanism following the disruptions caused by the COVID-19 Pandemic. 

Let us see how the global bond yields and interest rates of major nations have changed in the past six months:

Table 1: Data as on 29Nov2021:


Table 2: Data as on 21May2021:


As can be observed from the above two tables, major central banks have not raised the interest rates in the past six to nine months except those of Brazil and Russia. Brazil has raised its benchmark interest rates from 3.5 per cent to 7.75 per cent and Russia from 5 per cent to 7.5 per cent to rein in runaway inflation. 

During this period, Denmark has further lowered its interest rate, which is already in the negative zone. But Turkey is an extraordinary case. It has reduced its interest rates from 19 per cent six months ago to 15 per cent now. Turkey's supreme leader Recep Tayyip Erdogan seems to be driving the monetary policy in reverse gear, by cutting down interest rates drastically even though inflation has gone up substantially and Turkish Lira has been falling precipitously. 

Other central banks (not in the above list) that raised interest rates are South Korea, South Africa, Poland, Hungary, Singapore, Pakistan and Mexico. 

Interestingly, there were only three nations--namely, Germany, the Netherlands and Switzerland (Table 2 above)--where the 10-year benchmark bond yields were negative in May2021. But as of today, there are five countries--namely, Germany, the Netherlands, Switzerland, Finland and Denmark (Table 1 above)--where bond yields are negative.

Though global bond yields have not changed in the past six months, they went up considerably during the first quarter of 2021 (that is, Jan-Mar 2021). The changes are captured in Table 3 below:


It would be interesting to see how inflation will move in the next two quarters given the ultra loose monetary policies of major central banks, rising inflation worldwide and the challenges posed by the spread of new Corona Virus Omicron variant.


- - -

P.S.: On 16Dec2021, Bank of England raised its policy interest rate to 0.25 per cent from a record low of 0.1 per cent. Mexico central bank, Bank of Mexico, on 16Dec2021 raised its benchmark interest rate from 5.0 per cent to 5.5 per cent.


Data as on 31Dec2021 (image added on 15Jan2022) > 


Tables with data of Oct2020, Jan2021 and Apr2021 >


References:

My tweet thread dated 22May2021 on global bond yields and interest rates

My tweet thread dated 03Apr2021

TE global bond yields

TE global interest rates

Disclosure:  I've vested interested in Indian stocks and other investments. It's safe to assume I've interest in the financial products discussed, if any.

Disclaimer: The analysis and opinion provided here are only for information purposes and should not be construed as investment advice. Investors should consult their own financial advisers before making any investments. The author is a CFA Charterholder with a vested interest in financial markets. 

CFA Charter credentials  - CFA Member Profile

CFA Badge


He blogs at:

https://ramakrishnavadlamudi.blogspot.com/

https://www.scribd.com/vrk100

Twitter @vrk100

Saturday, 2 October 2021

BSE Broad and Sectoral Indices Market Cap - vrk100 - 02Oct2021

BSE Broad and Sectoral Indices Market Cap 


(A new blog post is available here with an update of the information as of 31Dec2021)


How have the market capitalisations of stock indices of BSE Limited changed this year? Let us examine the data and see what we can find from it.

Table 1: Market Capitalisation of BSE Broad and Sectoral Indices as on 30Sep2021: 


Broad Indices

Since the start of 2021, market cap of all BSE listed firms has grown by 38 per cent to Rs 259.87 lakh crore. Market caps of BSE Small cap, BSE Mid cap, Sensex and BSE AllCap indices have risen by 58, 40, 25 and 39 per cent respectively year-to-date. 

It is worth noting that the 39 per cent increase in BSE AllCap index is in line with the 38 per cent rise in market cap of all BSE listed firms--as the market cap of BSE AllCap represents 96.8 per cent of total market cap of all BSE listed companies (data in Table 1 above). 

As on date, BSE AllCap index has 906 stocks, whereas the total number of all BSE listed companies is more than 4,000.

-------------------

Read more:

Do Paint Stocks and Crude Oil Tango?

BSE Broad and Sectoral Indices Returns

Real Estate Stocks and REITs

When Will Federal Reserve Raise Interest Rates? 

The Central Triad in Taleb's Antifragile

-------------------

Sensex and BSE 500 accounted for 48.8 and 94.1 per cent respectively of total BSE market cap as on 31Dec2020. But as the BSE mid- and small-cap stocks have delivered superior returns compared to Sensex companies this year, the share of Sensex in total BSE market cap has fallen year-to-date (YTD). 

As on 30Sep2021, Sensex and BSE 500 indices represent 44.3 and 91.8 per cent respectively of total BSE market cap.

It may be noted that the market cap of all listed BSE firms undergoes a change all the time because new listed companies are added (through initial public offerings or IPOs) and delisted companies go out of the data. 

For example, BSE AllCap index had 849 stocks at the end of last calendar year; now it has 906 stocks aided mainly by the addition of new companies through IPOs, like, Zomato, Vijaya Diagnostic Centre, CarTrade Tech and Devyani International.

Sectoral Indices

Of the major BSE sector indices, the market cap of BSE Basic Materials index has increased the most (67.5 per cent YTD), whereas the BSE FMCG delivered the lowest market cap rise of 22.6 per cent YTD. Major stocks in BSE Basic Materials index are Tata Steel, UltraTech Cement, Hindalco, UPL Ltd, Vedanta Ltd and Pidilite Inds. 

However, BSE Utilities market cap has jumped the most (73.8 per cent YTD) though its total market cap is just 4.2 per cent of total BSE market cap. BSE Utilities is represented by stocks such as, NTPC, Power Grid Corporation, Adani Transmission, Indraprastha Gas, Indian Energy Exchange and Gujarat State Petronet. 

Of the major sectoral indices, BSE Finance is underperforming this year as bank stocks have failed to attract the attention of investors. In addition to BSE Finance and BSE FMCG, other indices that have delivered subdued returns this year are BSE Auto and BSE Healthcare. 

The shares of FMCG, Healthcare and Auto indices in total BSE market cap have fallen from 8.9, 6.4 and 4.6 per cent respectively (as on 31Dec2020) to 7.9, 5.8 and 3.9 per cent respectively (as on 30Sep2020).

The returns generated by BSE Broad and Sectoral indices can be accessed in my previous article.


Table 2: BSE Broad and Sectoral Indices - market cap, P/E, P/B and dividend yield as on 30Sep2021:


As can be observed from Table 2 above, the price-earnings (P/E) ratio of Sensex is 30.8 whereas those of BSE Mid cap and Small cap are 33.4 and 44.0 respectively. The valuations of Indian stocks appear to be rich compared to valuations of Indian stocks historically.

However, financial markets have their own logic--reasoning and opinions of a single individual don't matter. Overall, market are efficient, but there are times when markets become highly inefficient by swinging between outright optimism and downright pessimism.  

Earnings of several Indian companies (similar to several companies in other countries) have been negatively impacted in the past 18 months by the COVID-19 pandemic. As the earnings are depressed now, the valuation ratios, such as, P/E and P/B appear to be on the higher side. 

The current valuations seem to be factoring in good economic growth in the next few years. As they say, markets are forward-looking; let us see how things pan out in the next few quarters.


Past data

Table 3 and 4: If you are interested in comparing the valuation ratios (P/E, P/B and dividend yield) of  previous periods, you can compare the same with the data, as of 31Dec2020 and 31Mar2021, presented below:


- - -

Note:  Market capitalisation or market cap is nothing but the market value of a listed company calculated by multiplying its current share price and the company's total number of fully paid-up equity shares outstanding on a particular date.

References:

BSE Index watch 

Tweet dated 31Mar2021 - BSE market cap, P/E, P/B and dividend yield

Tweet dated 31Mar2021 - BSE market cap change %

Tweet dated 31Dec2020 - Index level, no of companies, BSE market cap, P/E, P/B and dividend yield


Disclosure:  I've vested interested in Indian stocks and other investments. It's safe to assume I've interest in the financial products discussed, if any.

Disclaimer: The analysis and opinion provided here are only for information purposes and should not be construed as investment advice. Investors should consult their own financial advisers before making any investments. The author is a CFA Charterholder with a vested interest in financial markets. 

CFA Charter credentials  - CFA Member Profile

CFA Badge


He blogs at:

https://ramakrishnavadlamudi.blogspot.com/

https://www.scribd.com/vrk100

Twitter @vrk100


Friday, 1 October 2021

Global Market Data 30Sep2021 - vrk100 - 01Oct2021

Global Market Data 30Sep2021  

Quarter-to-date global market data, as on 30 September 2021, of stocks, bonds, currencies and commodities is as follows: 

Table 1: (please click on the image to view better)

QTD, global stocks have remained more or less at the same level. S&P 500 is up just 0.23 per cent while Nasdaq Composite index is down 0.38 per cent. Hang Seng is down 14.75 per cent. But of the major markets, Indians stocks have delivered among the best returns. Nifty 50 and BSE Midcap indices rose by 12 per cent each. 


-------------------

Read more:

Do Paint Stocks and Crude Oil Tango?

Real Estate Stocks and REITs

When Will Federal Reserve Raise Interest Rates?

Real Estate Investment Trusts REITs 08Feb2021

What are REITs?

-------------------


It's interesting to note India 10-year yield rose by 17 basis points, whereas the US Treasury yield was up by three basis points for the quarter. Gold almost remained the same whereas silver is down 16 per cent. Crude oil prices are up between 2.7 and 4.5 per cent. 

US dollar index (DXY) is up 2.1 per cent; British pound and Euro have weakened by more than two per cent versus the US dollar. Bitcoin is up 25 per cent. Indian rupee and Chinese yuan has remained almost same.


Year-to-date global market data are presented below:

Table 2: (please click on the image to view better)


Year-to-date too Indian stocks have delivered one of the best returns clocking gains of almost 25 per cent. But Indian mid-cap stocks have done much better than large-cap stocks. Bloomberg commodity index is up 29 per cent driven by red-hot crude oil prices. 

Gold and silver are down by nearly eight and 17 per cent. Bitcoin surged by more than 50 per cent. US dollar index rose by almost five per cent; Euro is down 4.9 per cent versus dollar while the dollar is up 7.9 per cent versus the Japanese Yen.

India 10-year bond yield rose by 32 basis points whereas US 10-year Treasury yield jumped up 48 basis points; driven mainly by bond tapering signals by the US Federal Reserve and global inflationary pressures caused by supply chain bottlenecks, COVID-19-induced restrictions and labour shortages globally.

Overall, global stocks seems to be cooling a bit in recent weeks after giving spectacular returns in the past 18 months while commodities (except precious metals) are generally showing strong price momentum. 

Global volatility of financial and real assets may rise in the next few months as the US Fed is expected to start tapering its monthly bond purchases.


P.S.: The data presented in the above two tables are captured today between 6.30 and 6.45 AM IST.

- - -

Disclosure:  I've vested interested in Indian stocks and other investments. It's safe to assume I've interest in the financial products discussed, if any.

Disclaimer: The analysis and opinion provided here are only for information purposes and should not be construed as investment advice. Investors should consult their own financial advisers before making any investments. The author is a CFA Charterholder with a vested interest in financial markets. 

CFA Charter credentials  - CFA Member Profile

CFA Badge


He blogs at:

https://ramakrishnavadlamudi.blogspot.com/

https://www.scribd.com/vrk100

Twitter @vrk100