Showing posts with label flow of resources. Show all posts

Wednesday, 25 May 2022

Slowing Foreign Direct Investment to India - vrk100 - 25May2022

Slowing Foreign Direct Investment to India


(Effective May2024, all the forex data are updated in new blog Forex Data Bank) 


(please check updates 22May2024, 10Nov2023 and 25May2023, with latest data, at the end of the article) 


Foreign Direct Investment (FDI) inflows to India have slowed down in the financial year 2021-22, according to data from Reserve Bank of India (RBI).

India depends heavily on foreign capital, which flows into India through two routes mainly -- foreign direct investments (FDI) and foreign portfolio investments (FPI). Of the two, FDI flows are preferable to FPI flows in view of the fact that FDI is long-term in nature and more sustainable. On the other hand, FPI is considered ‘hot money’ and is prone to volatility in the financial markets.

In a baffling and misleading press note some days ago, India's Ministry of Commerce & Industry claimed that "India gets highest FDI inflows of USD 83.6 billion in FY 2021-22," and "FDI inflows increased 20-fold in the past 20 years." 

India's fawning media reported these claims verbatim without bothering about their veracity. (Remember the character Uriah Heep in Charles Dickens' "David Copperfield"? -- I'm dreadful of such obsequious types.)

I got curious to find out why was the Ministry want us to know the information in the first place (governments are known for controlling the narrative 24 x 7 x 365). 


(story continues below)

-----------------------
 
Related Articles:

When will FPIs stop selling Indian stocks?
 
Foreigners Shrinking Pie in Indian Equities
 
FPI flows into Indian stock market
 
Flow of Resources to Commercial Sector
 
-----------------------
 
Then I checked the official data. The Ministry's disinformation drama is as follows: For 2021-22, the gross FDI inflows are USD 83.6 billion, but the repatriation / disinvestment amount# is USD 28.6 billion--so the actual FDI to India is only USD 55 billion for the year.
 
(# Multi-national companies (MNCs) present in India repatriate profits in the form of dividends, royalties and others every year. Some companies close their businesses in India and take out their money. These numbers are reported as repatriation / disinvestment by RBI.)
 
From this USD 55 billion, we need to deduct FDI by India (the investments made by Indian companies in foreign countries) which is USD 15.7 billion. So, the net FDI flows to India are only USD 39.3 billion in 2021-22; and not  USD 83.6 billion as claimed by the Ministry.
 
The Ministry's another claim "FDI inflows increased 20-fold in the past 20 years," also turned out to be false. Net FDI to India in 2001-02 was USD 4.7 billion as per data from RBI. Net FDI to India in 2021-22 is USD 39.3 billion--an increase of 8.3 times, not 20-fold as incorrectly claimed by the Ministry.
 
The relevant figure for the country is net FDI to India (after repatriation / disinvestment and net FDI by India), not gross FDI inflows. The Ministry's data conveniently ignores the print of repatriation / disinvestment and FDI by India. Of course, this type of disinformation is not new in India. That's why we should never take government numbers at face value. As some wise man said, facts are not truth.
 
As delineated in below Table, the net FDI to India has fallen by 10.6 per cent to USD 39.3 billion in 2021-22 as compared to previous year's print of USD 44 billion. This is official data from RBI, India's central bank. 
 
Table: Data of FDI to India and FDI by India from 2006-07 to 2021-22:


References:
 
RBI DBIE - Handbook on Indian Economy
 
RBI Monthly Bulletin  
 

- - - 

 
P.S. 5 dated 22May2024: New chart with data of Gross FDI Inflows and FDI Repatriated from FY 2006-07 to 2023-24 > 
 
While gross FDI inflows to India are up 97% (CAGR 7%) in the past 10 years, FDI repatriated out of India is up by a staggering 740% ( CAGR 23.7%). 
 
Table 3: FDI inflows are down 13.7% (CAGR -1.5%) in the past 10 years from USD 30.8 billion in 2013-14 to USD 26.6 billion in 2023-24, as per latest data from RBI.


Table 2: Data from 2006-07 to 2023-24: Gross FDI inflows, FDI repatriated, FDI to india, FDI by India and net FDI; and their annual growth rates are given here:
 
While gross FDI to India in FY 2023-24 remains stagnant at USD 71 billion, FDI repatriated surged by 51% to USD 44.4 billion. 
 
Net FDI to India (after deducting FDI by India) is just USD 10.6 billion in FY 2023-24, down a staggering 62.2% compapred to previous year.


P.S. 4 dated 22May2024: Chart with updated data for FY 2023-24 > 
 
One of the biggest economic policy failures of PM Modi gov't is the precipitous fall in FDI in the past three years consecutively.
 
In fact, net foreign direct investment (FDI) to India in FY 2023-24 is just USD 10.6 billion, which is the lowest in 17 years. 


P.S. 3 dated 10Nov2023: Chart with updated data for FY 2022-23 > 
 
The updated chart shows figures in Rs crore for FY 2022-23.

In the past 9 years under PM Modi gov't, FDI inflows showed an absolute growth of 29.8 percent or just 2.94 percent annualised growth (CAGR) which can be considered as abysmal.


P.S. 2 dated 25May2023: Chart with updated data for FY 2022-23 > 
 
The updated data show that net FDI to India in FY 2022-23 is down a massive 27 percent year on year in USD terms to USD 28 billion vs USD 38.6 billion previous year. 
 
(in 2010-11, net FDI to India was down 34%)


P.S. 1: Latest data from RBI press release dated 22Jun2022 >  "Net FDI inflows at US$ 38.6 billion in 2021-22 were lower than US$ 44.0 billion in 2020-21."

-------------------

Read more: 

JP Morgan Guide to Markets

Rant on Tata Steel Ltd

A Quick Glance at UPL Limited 

What is Cooking Behind LT Foods' Share Price Rise?

A Rundown on Prince Pipes & Fittings

Primer on Credit Rating Scales

When Will Foreign Investors Stop Selling Indian Stocks?

Indian Mutual Funds and The Art of Ripping Off Investors  

Do Paint Stocks and Crude Oil Tango?

Weblinks and Investing

-------------------

Disclosure:  I've vested interested in Indian stocks and other investments. It's safe to assume I've interest in the financial instruments / products discussed, if any.

Disclaimer: The analysis and opinion provided here are only for information purposes and should not be construed as investment advice. Investors should consult their own financial advisers before making any investments. The author is a CFA Charterholder with a vested interest in financial markets. 

CFA Charter credentials  - CFA Member Profile

CFA Badge


He blogs at:

https://ramakrishnavadlamudi.blogspot.com/

https://www.scribd.com/vrk100

Twitter @vrk100


Friday, 3 December 2021

Update - Bank Disintermediation and Flow of Resources to Commercial Sector - vrk100 - 03Dec2021

Update - Bank Disintermediation and Flow of Resources to Commercial Sector


This is an update of my article 'Bank Disintermediation and Flow of Resources to Private Sector' dated 26Sep2020:


The corporate sector and households in India raise resources from a variety of sources. Due to bank disintermediation, the commercial sector in India has got a slew of sources to raise monies from. 

The commercial sector has diversified its sources of finance to non-banking finance companies (NBFCs), stock market, rights issues, private placement and foreign sources like external commercial borrowings (ECBs) and foreign direct investment (FDI).

-------------------

Read more:

India Second Quarter GDP 

Global bond yields and Interest rates

Do Paint Stocks and Crude Oil Tango?

BSE Broad and Sectoral Indices Returns

Real Estate Stocks and REITs

When Will Federal Reserve Raise Interest Rates? 

The Central Triad in Taleb's Antifragile

Weblinks and Investing

-------------------


Those interested for a detailed analysis of bank disintermediation and flow of private sector resources may refer to my article written in 2020.  

In this article, I'm providing just an update with data available up to financial year 2020-21.

Chart providing data from 2014-15 to 2020-21 (click on the image for larger picture) >


During 2020-21, the money flow to the commercial sector increased by 11.8 per cent to Rs 16.97 lakh crore (Rs 15.17 lakh crore in 2019-20), showing an absolute growth of Rs 1.80 lakh crore -- of which major growth is from commercial paper issued by non-banks (row B1 iii), credit from NBFCs and accommodation by all-India financial institutions, such as, NABARD, NHB, etc.

Interestingly, money raised from ECBs is almost nil in 2020-21, while growth in FDI is just Rs 10,000 crore. The share of foreign sources fell to 22 per cent of the total flow in 2020-21 from 36 per cent in 2019-20.

As can be gleaned from the above table, the private sector's reliance on bank credit has come down from 42.9 per cent in 2014-15 to 33.7 per cent in 2020-21, as per data from Reserve Bank of India (RBI). The share of bank credit in total resources fluctuated between 34 per cent and 52 per cent of total flow in the past six years.

The media often highlight the fact that bank credit growth is tepid, as if it is the only source of funding for the commercial sector. As we've seen, the importance of bank credit for the growth of commercial sector in India has come down drastically over the years and as such you may correct the ignorant media above this.

- - -

References:

RBI Handbook of Statistics on Indian Economy 15Sep2021

Table 65: Flow of Resources to the Commercial Sector in India

My tweet dt 26Sep2020 on Flow of Resources to the Commercial Sector

My tweet dt 15Sep2018 on Flow of Resources to the Commercial Sector

RBI Mint Street memo dated 03Jan2018 Credit Disintermediation from Banks - Has the Corporate Bond Market Come of Age?


Disclosure:  I've vested interested in Indian stocks. It's safe to assume I've interest in the stocks discussed, if any.

Disclaimer: The analysis and opinion provided here are only for information purposes and should not be construed as investment advice. Investors should consult their own financial advisers before making any investments. The author is a CFA Charterholder with a vested interest in financial markets. He blogs at:

http://scribd.com/vrk100

Twitter @vrk100    

Saturday, 26 September 2020

Bank Disintermediation and Flow of Resources to Private Sector-VRK100-26Sep2020

Bank Disintermediation and Flow of Resources to Private Sector-VRK100-26Sep2020


(Update dated 03Dec2021 of this article is available)

Private sector in India raises resources from a variety of sources. Private sector includes both the corporate sector and households. The corporate sector raises monies traditionally from banks. Over the years, they have diversified their sources. Now, they tend to raise resources from domestic sources, such as, non-banking finance companies (NBFCs) and stock market. Routes for raising money from stock market include: initial public offers - IPOs; follow-on public offers - FPOs; rights issues or through private placement (like, qualified institutional placement or QIP). 


A related topic in corporate finance is pecking order theory, which shows the order in which corporates prefer to raise resources. As per pecking order theory, it is cheaper and easier for corporates to obtain resources internally. So, the first order of preference is raising internal resources. And the second in line is debt, because cost of debt is cheaper, due mainly to tax efficiency, versus cost of equity. And the last in line is equity after exhausting the first two options.


The private sector raises resources from external sources also, via foreign currency loans in the form of foreign currency convertible bonds (FCCBs) and external commercial borrowings (ECBs). More importantly, Indian corporates attract a lot of money from foreign direct investment (FDI) route.


Financial market professionals (FMPs) often focus on bank credit growth rate, which is a high frequency indicator. With rapid changes in bank disintermediation, credit to the private sector is now dominated by non-bank sources. As a result, bank credit growth numbers have become less relevant in India like their Western counterparts. When we say bank credit growth rate has fallen to 5% or 6%, it conveys little meaning.


Bank disintermediation means raising of resources by the private sector (both the corporate as well as households) from entities other than banks. This disintermediation, started in the early 1990s, has been going on with the share of non-banking sources growing rapidly in recent years.


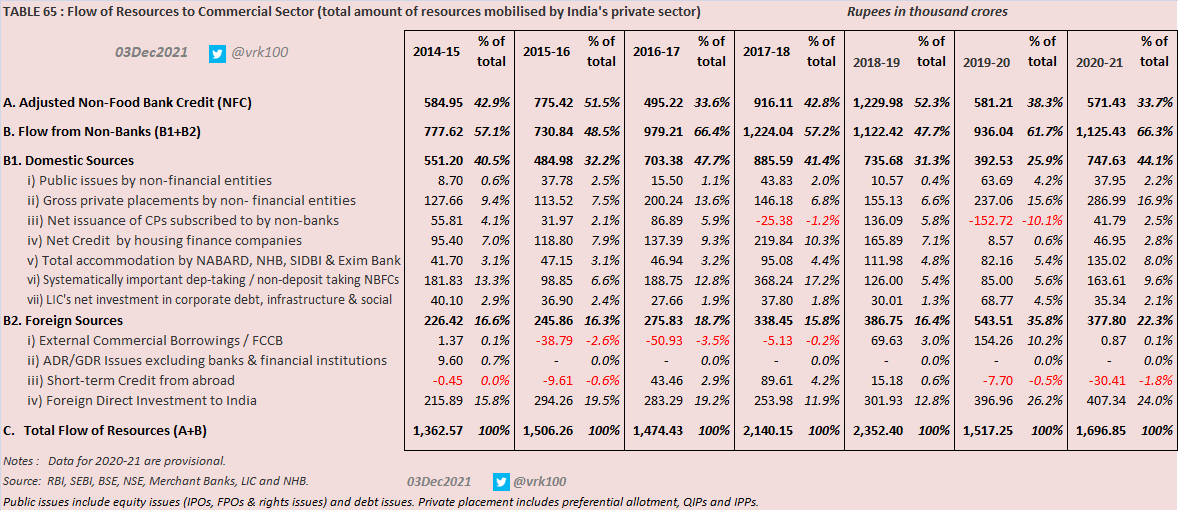
Chart providing data from 2009-10 to 2019-20 (click on the image for larger picture) > 


As can be seen from the above table, the private sector's reliance on bank credit has come down from 42.9% in 2014-15 to 40.2% in 2019-20, as per data from Reserve Bank of India (RBI). The share of bank credit fluctuated between 34% and 52% of total flow in the past five years.


Large sums of money have flowed into debt mutual funds in recent years. As a result, mutual funds' role in providing resources through bond investments in the corporate sector has gone up considerably as can be observed from steep rise in assets managed by the mutual funds, which typically invest in bonds of companies, NBFCs and HFCs.


Changes in FY 2019-20 compared to FY 2018-19:

As can be seen from the above table, resources mobilisation by the private sector declined drastically in 2019-20.


Total flow of resources to commercial sector fell by 39% in 2019-20 to Rs 14.46 lakh crore from Rs 23.52 lakh crore in 2018-19--this decline has adversely impacted India's GDP growth. The fall is mainly due to steep fall in bank credit by 53% to Rs 5.81 lakh crore and fall in commercial paper (CP) issuance. Others that contributed to the decline are credit by HFCs (95% fall to just Rs 8,600 crore loan disbursement) and NBFCs (89% fall to just Rs 13,600 crore).


Post IL&FS scam, loan disbursals by housing finance (HFCs) and non-financial banking companies (NBFCs) got decimated. Commercial banks too are having their own problems especially public sector banks (PSBs). Stung by high percentage of bad loans, PSBs are extremely averse to lending. Another issue that deters PSBs from lending is the onerous scrutiny of bad loans by central government enforcement agencies, such as, Central Vigilance Commission and others.


One bright spot for corporates in 2019-20 is foreign direct investments (FDI) into India, which surged by 32% to Rs 3.97 lakh crore. LIC of India's debt investments increased by nearly 130% to Rs 69,000 crore, which is the highest in the last 10 years.


Public issues and private placements too have shown significant rise. External flows from ECBs and FCCBs went up by more than 120% to Rs 1.54 lakh crore in 2019-20.


Lower finance from banks and NBFCs has negatively impacted the automobile sector--which depends heavily on finance.


In the past five years, flows from domestic sources have fallen by more than 40% to Rs 3.21 lakh crore in 2019-20, while flows from external sources have increased by 140% to Rs 5.44 lakh crore, signifying India's dependence on foreign money.


- - -

P.S.: Updated data which include data for 2020-21 > 


References:

My tweet dt 26Sep2020 on Flow of Resources to the Commercial Sector

My tweet dt 15Sep2018 on Flow of Resources to the Commercial Sector

RBI Mint Street memo dated 03Jan2018 Credit Disintermediation from Banks - Has the Corporate Bond Market Come of Age?

RBI Handbook of Statistics on Indian Economy 18Sep2020

Table 68: Flow of Resources to the Commercial Sector in India


Disclosure:  I've vested interested in Indian stocks. It's safe to assume I've interest in the stocks discussed, if any.

Disclaimer: The analysis and opinion provided here are only for information purposes and should not be construed as investment advice. Investors should consult their own financial advisers before making any investments. The author is a CFA Charterholder with a vested interest in financial markets. He blogs at:

http://scribd.com/vrk100


Twitter @vrk100