--------------------------------------------------------------
Update 09Jun2026: Chart 197:
Rupee Depreciation and India FPI Equity Flows: Correlation, Narrative and Reality:
The current narrative is that foreign portfolio investors (FPIs) are pulling money from Indian equity market because global capital is chasing the AI boom (especially in Taiwan, South Korea and the US tech), while India's earnings growth has disappointed and valuations remain relatively rich.
Rupee weakness versus dollar and other major currencies is cited as an additional headwind because it reduces dollar returns for foreigners.
Let us check whether the claim of experts regarding rupee depreciation is suported by long term data. This study covers the period from 2013 to 2026 (data till May2026).
CORRELATION YEARS:
The strongest apparent correlation is in 2018, 2022, 2025 and 2026: large FPI outflows from Indian stock market occurred alongside significant rupee depreciation. These years fit the narrative that foreign selling and rupee weakness moved together.
NO-CORRELATION YEARS:
2013 is the biggest contradiction: the rupee depreciated sharply (-11.5%) versus the dollar, yet FPIs bought a large USD 20 billion of equities.
Similar contradictions appear in 2014, 2015, 2016, 2019 and 2020, where the rupee weakened but FPIs were net buyers, bringing in dollars to India.
These years suggest rupee depreciation alone does not determine FPI behavior.
GLOBAL RISK-OFF YEARS:
From the chart alone, 2018 and 2022 stand out as the clearest risk-off years because they combine substantial FPI outflows with sharp rupee depreciation. Those were global liquidity events, not merely India currency events.
2018: Fed tightening, stronger dollar, emerging-market stress.
2022: Aggressive US rate hikes, strong dollar, global risk aversion.
2025 and 2026 were particularly painful for India, because other markets were doing well, while India is the worst performaing among the emerging markets.
In contrast, 2013 looks like a stress year for the currency but not a risk-off year for foreign investors, since FPI inflows remained very strong.
OVERALL MESSAGE:
The chart shows that rupee depreciation and FPI outflows sometimes occur together (2018, 2022, 2025, 2026), but there are also several years when FPIs invested heavily despite significant rupee weakness (especially 2013, and also 2014–16, 2019 and 2020).
This suggests that rupee depreciation by itself has not been a reliable long-term predictor of FPI flows.
However, financial markets are driven not only by fundamentals but also by narratives and momentum.
In the short to medium term, a narrative such as "the rupee is weakening, so dollar returns from India are deteriorating" can become self-reinforcing and influence capital flows even if the long-run historical relationship is weak.
The current episode is also different from many past years because investors are looking at a cumulative rupee depreciation of roughly 10 per cent over the last 18 months rather than a typical 2–4 per cent annual move.
When combined with concerns about earnings growth, valuations and the attractiveness of AI-related opportunities elsewhere (like Taiwan, South Korea and the US Tech), the currency move becomes much more meaningful for dollar-based investors.
Therefore, the data do not support the claim that rupee depreciation is a standalone driver of FPI outflows.
But it is entirely plausible that, in the current environment, a sizeable currency decline is amplifying a broader negative narrative and contributing to short- and medium-term foreign selling pressure.
Chart 197 showing FPI flows into Indian equity market verus Dollar Rupee Exchange rate Change (calenda year wise data from 2013 to 2026) >
--------------------------------------------------------------
Update 09Jun2026: Chart 196:
FPI Equity Flows to India: India
FPI Flows to Indian stock market, DII Flows to Indian stock market and
Individual Investor flows to India stock market - both in rupee terms as
well as dollar terms (old blog 10Jul2022) >
One chart:
1) calendar-year wise data from 2013 to 2026 >
Overview:
This
analysis looks at who has been putting money into Indian equity
markets—foreign investors (FPIs), domestic institutions (DIIs) and
individual investors—across different time periods.
The FPI selling of Indian equities continues unabated. The data in the chart are upto Apr2026.
In May2026, they sold stock worth Rs 33,000 crore and in this month (with only one week completed) alone they already sold equities worht Rs 56,000 crore.
--------------------------------------------------------------
Update 26Apr2026: Charts 194 and 195:
FPI Equity Flows to India: India
FPI Flows to Indian stock market, DII Flows to Indian stock market and
Individual Investor flows to India stock market - both in rupee terms as
well as dollar terms (old blog 10Jul2022) >
Two charts:
1) financial year wise data from 2014-15 to 2025-26
2) calendar-year wise data from 2013 to 2026 >
Overview:
This analysis looks at who has been putting money into Indian equity markets—foreign investors (FPIs), domestic institutions (DIIs) and individual investors—across different time periods.
By comparing yearly data with 3-year, 5-year and 10-year totals, it shows how market leadership keeps changing rather than staying constant.
Across FY2014-15 to FY2025-26, DIIs have invested over Rs 24 lakh crore (USD 295 billion), far exceeding FPIs at Rs 1.78 lakh crore (USD 34.0 billion), with individuals at Rs 3.55 lakh crore (USD 43.0 billion).
The shorter-term aggregates make this shift even clearer, highlighting the recent dominance of domestic money in driving markets.
Counterweight Phase: FY2020-21 and FY2021-22:
FY2020-21: FPIs bought Rs 2.74 lakh crore or USD 37.0 billion, while DIIs sold Rs 1.32 lakh crore or USD 18.0 billion.
FY2021-22: FPIs sold Rs 1.40 lakh crore or USD 18.5 billion, while DIIs bought Rs 2.22 lakh crore or USD 29.6 billion.
This is the textbook counterweight phase—flows offset each other, maintaining balance. This behavior historically defined Indian markets when foreign flows influenced marginal pricing.
Note: Every sell in the market is matched by a buy, so “counterweight” does not refer to existence of buyers. It refers to who provides incremental net demand that influences price direction and absorbs sustained selling pressure.
Shift to Domestic Dominance: Last 3–5 Years:
Past 3 years: FPIs at Rs -1.00 lakh crore, DIIs at Rs 16.65 lakh crore, Individuals at Rs 1.67 lakh crore.
Past 5 years: FPIs at Rs -2.77 lakh crore, DIIs at Rs 21.41 lakh crore, Individuals at Rs 3.81 lakh crore.
This marks a structural shift. Instead of counterbalancing, DIIs are overwhelming FPI selling. The magnitude is disproportionate—domestic flows are multiples of foreign outflows, indicating markets are being driven internally.
Recent Two-Year Pattern: FY2024-25 and FY2025-26:
FY2024-25: FPIs sold Rs 1.27 lakh crore or USD 14.6 billion; DIIs bought Rs 6.08 lakh crore or USD 71.8 billion.
FY2025-26: FPIs sold Rs 1.81 lakh crore or USD 19.7 billion; DIIs bought Rs 8.50 lakh crore and USD 95.8 billion.
These two years exaggerate the current regime. DII inflows are not just offsetting—they are significantly larger, pointing to strong domestic liquidity driving markets beyond foreign influence.
Over the past 12 years, total DII inflows are about USD 295 billion. Of this, nearly USD 168 billion—more than 50 percent—has come in just the last two financial years.
This indicates a sharp acceleration in domestic institutional participation, with flows becoming heavily concentrated in the most recent period rather than being evenly distributed over time.
Synchronized Buying Phase: FY2023-24:
FPIs bought Rs 2.08 lakh crore and USD 25.3 billion; DIIs bought Rs 2.07 lakh crore and USD 24.9 billion.
This is a rare alignment phase where both global and domestic liquidity were supportive. Such phases are typically short-lived and linked to strong momentum.
Long-Term Context: 10-Year View:
Past 10 years: All the three categories of investors had positive flows, with FPIs at Rs 0.81 lakh crore, DIIs at Rs 23.54 lakh crore, Individuals at Rs 3.67 lakh crore.
Over a full cycle, FPIs appear nearly neutral. DIIs dominate structurally, while individuals contribute but do not lead. This challenges the perception of sustained FPI dominance.
Individual Investors' Trend:
Up to FY2019-20: negligible or negative participation.
FY2020-21 to FY2022-23: surge Rs 0.68 lakh crore, Rs 1.65 lakh crore, Rs 0.49 lakh crore.
FY2023-24 to FY2025-26: cooling Rs 0.47 lakh crore, Rs 1.25 lakh crore, Rs -0.06 lakh crore.
Aggregate view: Rs 3.81 lakh crore over 5 years vs Rs 1.67 lakh crore over 3 years. Retail participation spiked post-2020 and is already fading, reinforcing that it is sentiment-driven, not permanent.
What Changed in the Latest Cycle:
The defining shift is the scale and persistence of domestic flows. Earlier, DIIs acted as a counterweight; now they dominate. This is evident in both yearly spikes and aggregated 3-year and 5-year data.
Will Current Trends Sustain?
Unlikely in a straight line. Counterweight phases will return when domestic flows weaken, synchronized buying will reappear during global liquidity expansions and retail participation will revive and fade with new narratives.
The 10-year data already shows how dominant trends normalise over time.
Bottom Line:
There are no permanent trends in markets. Leadership rotates across FPIs, DIIs and individuals depending on liquidity, returns and sentiment. The current dominance of domestic flows is real—but it is still a phase, not a permanent structure.
Tweet 26Apr2026 - error in NSE data, rectified by them after being pointed out
FPIs are foreign portfolio investors.
DIIs are domestic institutional investors.
According
to NSE India, DIIs include Banks, Insurance companies, Mutual Funds,
Domestic Financial Institution (Other than banks & insurance),
Domestic Venture Capital Funds, AIFs, PMS clients, New Pension System
(NPS) and NBFCs.
Individual
investors data for NSE secondary market only. Individuals include
individual /proprietorship firms, HUF (Hindu Undivided Family) and NRIs
(Non resident Indians).
Charts 194 and 195 click on the images to view better >
--------------------------------------------------------------
Update 24Apr2026: Charts 192 and 193:
FPI AUC data: FPI / FII AUC data: Assets under custody (AUC) data of foreign portfolio investors (FPIs):
Two charts >
FPI equity assets - Yearly data (past 10 years, financial year wise)
FPI debt assets - Yearly data (past 10 years, financial year wise) (for old data > Old blog dated 10Jul2022 - Exit India Policy by Foreign Investors; and old blog dated 28Apr2022 - Foreigners' Shrinking Pie in Indian Equities)
FPI
equity assets, as on 31Mar2026, are Rs 62.5 lakh crore, down from Rs 66.8 lakh crore as of 31Mar2025 -- due to a combination of stock market losses, sharp fall in Indian rupee versus dollar and massive FPI outflows in FY 2025-26 (Check Update 24Apr2026 with Charts 186 to 191 below for FPI equity flows and debt flows too).
FPI assets in India's equity segment are USD 660 billion in Mar2026, down a massive 30 per cent in the past 18 months (USD 930 billion in Sep2024).
FPI investors have been losing interest considerably in Indian stocks in the past five years -- their share has come down
from almost 20 per cent in Mar2021 to just 15.1 per cent now; conversely, domestic
investors' share has been rising gradually during the period.
FPI debt asets as of 31Mar2026 are Rs 7.1 lakh crore or USD 74.6 billion.
For a country of the size of India, FPI assets in the debt segment are a piffling USD 75 billion.
India stands out among emerging markets for its relatively low level of foreign participation in the domestic bond market, especially when compared with economies like South Korea, China and Brazil.
According to some estimates, foreign ownership of government bonds is less than 3 per cent of India's total public debt.
In comparison, the share of foreign participation in countries like, South Korea, China and Brazil is between 10 per cent and 20 per cent.
Data source:
Charts 192 and 193 >
--------------------------------------------------------------
Update 24Apr2026: Charts 187 to 191:
FPI Equity Flows to India: India
FPI Flows to Indian stock market and debt market in rupee terms > (old blog 10Jul2022) >
During the financial year 2025–26, FPI equity flows were negative in seven months, including a record monthly outflow of Rs 1.18 lakh crore in Mar2026—the highest in the 34-year history of FPI investments in India.
Although flows were positive in five months, the overall balance for FY 2025–26 turned into a net outflow of Rs 1.81 lakh crore, driven largely by the sharp outflows in Mar2026. Even in Apr2026 too, FPIs already sold stocks worth Rs 0.41 lakh crore, with another week to go this month.
In
the debt segment, the flows were better, with FPIs being net positive
in nine months, with the FY 2025-26 total inflows amounting to Rs 0.28 lakh crore.
Cumulative FPI flows to Indian equity markets are negative in the past five financial years.
As on 31Mar2026: Rs lakh crore
Past one year FPI equity flows -1.81
Past two year -3.08
Past three year -1.00
Past five year -2.77
Past 10 year 0.84
FPI debt flows are a saving grace for India, especially in the past three years.
As on 31Mar2026: Rs lakh crore
Past one year FPI debt flows 0.28
Past two year 1.75
Past three year 3.06
Past five year 3.21
Past 10 year 3.53
Some possible reasons why FPIs have been selling Indian equities:
Foreign investors have a whole variety of countries to invest in. India, now, is not the only play for them.
As investors have become enthusiastic about AI boom and massive bets on AI infrastructure, foreign investors find emerging markets like, South Korea and Taiwan more promising and these two countries have been receiving inflows, while foriegners have been selling Indian stocks.
In the six quarters alone (period Oct2024-Mar2026), FPIs sold Indian equities worth nearly Rs 4 lakh crore -- this is one of the highest outflows the country has witnessed.
Even some investors find Brazil market too more attractive due to its commodity play. China too has attracted more inflows.
India is so negative in the eyes of FPIs, its share in the MSCI EM index declined from nearly 20 per cent (second rank in the index then) to 12.6 per cent in Mar2026 (4th rank now) (check update 22Apr2026 with Chart 186 below).
Corporate earnings growth has decelerated recently. As such, foreigners have turned lacklustre towards Indai. FDI flows too have not been encouraging in the past four years.
Indian governments are focusing more on doles, rather than building for the future.Rupee depreciation and earnings concerns too have weighed on FPIs.
Key factors influencing FPI flows (not just taxes) >
Relative valuation of Indian stocks
Political stability
Reliability of legal / judicial systems
Currency stability / forex risk
Interest rate differentials
Liquidity & market depth (ease of entry & exit)
Corporate governance
FPIs are foreign portfolio investors.
Five charts >
India FPI flows (both equity and debt) financial year wise
India FPI equity flows monthly (15 months)
India FPI equity flows quarterly (15 quarters)
ndia FPI debt flows monthly (15 months)
India FPI debt flows quarterly (15 quarters)
Charts 187 to 191 click on the image to view >
--------------------------------------------------------------
Update 22Apr2026: Chart 186:
MSCI EM Index - China and India weights: Quarterly changes between Dec2024 and Dec2025: (for old data, see old blogs dated 07Jan2023 and blog 03Aug2021 and previous charts below)
Overview:
MSCI Emerging Markets Index composition remains stable in breadth (24 countries) as of 31Mar2026. Market cap is broadly flat QoQ (quarter on quarter) but shows YoY (year on year) growth of nearly 30%, indicating recovery and capital inflows over the past year.
Market Capitalisation increase YoY reflects improved valuations and market performance across EM.
Valuation Metrics:
Forward P/E: Significant compression QoQ (11.52 vs 13.48) and modest decline YoY (11.52 vs 11.96), suggesting cheaper valuations recently after a period of optimism.
Price-to-Book: Stable QoQ (2.2), but up YoY (2.2 vs 1.8), indicating higher asset valuation multiples over the year.
Dividend Yield: Slight improvement QoQ (2.32% vs 2.28%), but lower YoY (2.32% vs 2.65%), implying some shift toward growth over income.
Country Weights:
QoQ: China weight declined sharply (25.48% vs 27.63%), while Taiwan and South Korea gained; India weight decreased notably (12.58% vs 15.30%).
YoY: China weight significantly lower (25.48% vs 31.29%), India also reduced (12.58% vs 18.52%), while Taiwan and South Korea gained share—indicating rotation away from China/India dominance toward North Asia tech-heavy markets.
Concentration Trends (Countries):
Top 5 concentration remains high, but internal reshuffling shows declining China dominance and rising importance of Taiwan semiconductor exposure and South Korea.
Top Companies:
QoQ: TSMC weight increased materially (13.29% vs 11.88%), reinforcing concentration risk; Tencent and Alibaba weights declined; Samsung relatively stable.
YoY: TSMC dominance sharply higher (13.29% vs 8.6%), while Chinese tech (Tencent, Alibaba) weights declined overall, indicating a shift toward semiconductor leadership.
Concentration Trends (Stocks):
The index is becoming more top-heavy, meaning a few large companies—especially TSMC—now have a bigger influence on performance. The weight of this single stock is more than the country weight of India, Brazil and others. Only country weights of China, Taiwan and South Korea are greater than the TSMC weight.
To sum up:
QoQ: Valuations corrected downward, China and India weights reduced, and semiconductor exposure increased.
YoY: Strong market cap growth, declining China dominance, rising Taiwan/Korea influence, and increasing concentration in a few mega-cap tech names led by TSMC.
Chart showing MSCI EM Index matrix showing data fo rthe past five quarters >
--------------------------------------------------------------
Update 01Apr2026: Charts 184 and 185:
Global market data: Global market data pertaining to stocks, bonds,
commodities and currencies are presented here (old blog dated 29Jun2024).
Quarter-to-date
(QTD) global market data, as on 31st of March, 2026, of stocks, bonds,
currencies and commodities is as follows:
During Jan-mar2026 quarter (QTD),
the stand-out performance from crude oil, WTI and Brent have skyrocketed by 78 and 94 respectively (note Bloomberg / Trading Economics are showing divergent rates for Brent, as of 31Mar2026, for unknown reasons -- CNBC rate is considered for the analysis).
Gold and silver experienced subdued returns, after spectacularly well in 2025. Bitcoin continues to disappoint this quarter too.
Stock marekts globally are mostly down, driven by Iran war concerns. Only, FTSE and Nikkei posted meagre gains.
Indian stock are one of the worst performing in the quarter.
Bond yields are rising globally, due to geopolitical risks to world economy emanating from a raging war in the Middle East. Inflationary expectations have surged due to higher oil prices.
US dollar index (DXY) rose by 1.7 per cent, with dollar gaining vs JPY, EUR and GBP.
Indian currency is one of the worst performing among emerging markets. India, a commodity importer, is adversely impacted by the Third Gulf War.
Past one year returns: In the past one year, silver and gold delivered spectacular returns of 122 and 49 per cent respectively. So is crude oil.
Bloomberg commodity index delivered a return of 27 per cent.
In stocks, Nikkei 225, Nasdaq Composite, Shanghai and FTSE 100 provided superior returns.
Indian stocks are a disappointment.
The US dollar index lost 4 per cent of its value in the past one year. While the dollar gained versus JPY, it depreciated against Euro and British Poound.
The one year return (YTD) chart is also attached below.
QTD and one-year returns >
--------------------------------------------------------------
Update 31Mar2026: Chart 183:
Dollar Rupee exchange rate: USD INR Exchange Rate: Financial year-wise data of the US dollar-Indian rupee exchange rate for the past 28 years (previous blog dated 03Jun2024 on Why RBI Won't Favour a Strong Rupee and preivous blog dated 01Jun2024 on how to calculate currency depreciation and appreciation) >
USD-INR yearly gain / loss
Exchange rate yearly gain / loss
Dollar rupee yearly gain / loss
USD-INR financial-year and calendar-year end data
USD-INR change %:
Financial year-wise: Dollar gain versus Rupee: Data include not only year-wise changes but
also 5-year change (annualised) and 10-year change (annulised or CAGR).
For example, between end-Mar2021 and
end-Mar2026, the USD appreciated by 5.2 per cent annualised rate. And
between end-Mar2011 and end-Mar2016, the annualised USD appreciation vs
INR was much higher at 8.2 per cent.
Likewise, between end-Mar2016 and end-Mar2026 (10 year range), the USD appreciated by 3.6 per cent annualised rate (CAGR).
For the past 25 years, US dollar has appreciated by an annualised 2.87 per cent versus India rupee.
Data range for FY-wise yearly change
for the past 27 years is: minus 11.4 per cent to plus 27.5 per cent.
The data range is so wide one can't even predict / forecast the yearly
changes in USD-INR exchange rate.
Of
the 27 financial years for which data are presented here, Govt of India
and Reserve Bank of India allowed the rupee to appreciate against the
dollar only on eight occasions.
Data for USD–INR are from RBI DBIE. All other calculations are by the author.
Explanation for two columns in the two tables presented below >
Column 3 (USD–INR change %):
This shows how much the value of one US dollar changed compared to the
Indian rupee during the year. A positive number means the dollar became
stronger (it took more rupees to buy one dollar). A negative number
shows the dollar depreciation versus rupee (dollar became weaker).
Column 7 / extreme right (INR–USD change %):
This shows how much the value of one Indian rupee changed compared to
the US dollar during the year. A positive number shows the rupee
appreciation (one rupee could buy more dollars). A negative number means
the rupee became weaker versus the dollar.
To know more about the currencies and how to calculate depreciation and appreciation of currency pairs, please check previous blog.
Long term trends:
The USD-INR exchange rate shows a clear long-term uptrend, meaning the Indian rupee has steadily depreciated against the US dollar over the past 25+ years. The rate moved from around 42–44 in the early 2000s to about 94.7 by Mar-2026.
The rupee saw a sharp depreciation in FY2025-26, with USD rising 10.7 per cent to 94.7 (conversely rupee depreciated by 9.6 per cent). This is one of the steepest annual moves in the dataset, comparable to crisis-like periods, like, COVID-19, Fed taper tantrum or global financial crisis (GFC) of 2008.
Periods of Sharp Depreciation:
From the 27 financial years shown (FY2000–FY2026), the US dollar gained (conversely, rupee depreciated) more than 8 per cent against the Indian rupee on six occasions.
Major stress years stand out clearly: FY2008-09 (27.5% dollar appreciation vs 21.6% rupee depreciation), FY2011-12 (12.7% rupee depreciation), FY2013-14 (9.5% rupee depreciation), FY2019-20 (8.2% rupee loss), FY2022-23 (7.8% rupee loss), and FY2025-26 (9.6% rupee depreciation).
Six out of 27 years is roughly 22 per cent of the time (about one in every 4–5 years). This shows that sharp depreciation events are not rare—they occur periodically as part of broader economic cycles. These events are not evenly spaced; they tend to cluster around stress periods.
Key Takeaway:
While average annual depreciation may look moderate, the distribution is skewed—large moves happen in bursts. Any long-term view of USD-INR exchange rate must account for these occasional but impactful spikes.
Implications of rupee depreciation for NRIs (non resident Indians), especially those who live in America:
Core Idea in Simple USD-INR Terms:
Think of it this way: what cost Rs 47 per USD earlier in 2011/12 now costs about Rs 95 per USD. The rupee has roughly halved in value in the past 14–15 years. So if an NRI converted USD into Indian rupees back then, their money—when viewed in US dollar today—has effectively been cut in half unless the asset they bought has grown enough to compensate.
Illustration: The Rs 47 to Rs 95 Reality
Around FY2012, 1 USD ≈ Rs 47.
Today, it appreciated to Rs 95.
Example:
USD 100,000 in 2012 → Rs 47 lakh invested in India
Today, Rs 47 lakh converts back to only about USD 50,000
So purely due to currency movement, the dollar value is roughly halved.
This is the “hidden loss” NRIs often miss because they track wealth in rupees.
What Must Happen to Break Even:
To just get back the original USD 100,000, that Rs 47 lakh must become about Rs 95 lakh today.
In simple terms:
Your investment must double just to break even in USD.
Anything less than doubling = loss in USD
Anything more than doubling = real gain in USD
So the real question is not “did my asset go up?” but “did it go up enough to offset the rupee fall?”
5-Year Example (Recent Reality):
5 years ago, USD INR was around Rs 75–76; today nearly Rs 95.
Example:
USD 100,000 → Rs 75 lakh → now worth only USD 79,000 if no growth in the underlying asset.
Even in just 5 years, you lose around 20 percent in USD terms without asset growth.
So your asset must grow from Rs 75 lakh to about Rs 95 lakh just to stand still.
10-Year Example:
10 years ago, USD-INR was around Rs 62–65; today Rs 95.
Example:
USD 100,000 → ~Rs 63 lakh → now USD 66,000 if unchanged.
You need Rs 63 lakh to become Rs 95 lakh (about 50 percent growth) just to break even.
15-Year Perspective:
15 years ago, USD INR was around Rs 45–47; today Rs 95.
Example:
USD 100,000 → Rs 46 lakh → now roughly USD 48,000–50,000.
You need the asset to roughly double over this period just to maintain USD value.
20-Year Perspective:
20 years ago, USD-INR was around Rs 43–45; today Rs 95.
Example:
USD 100,000 → Rs 44 lakh → now about USD 46,000.
Again, nearly two times growth required just to preserve dollar value.
25-Year Perspective:
25 years ago, USD-INR was around Rs 42–43; today Rs 95.
Example:
USD 100,000 → Rs 43 lakh → now about USD 45,000.
Same conclusion: the rupee has roughly halved, so assets must double just to break even in USD terms.
What This Means for Different Assets?
If your Indian asset:
Did not double over 10–15 years → you lost money in USD
Just doubled over 15 years → you barely broke even
Tripled or more → you made real USD gains
This is why:
Equities (which can grow three to five times over long periods) can beat currency loss.
Real estate (often 1.5x–2.5x over long periods) may only break even or underperform in USD.
Why Many NRIs Misjudge This:
NRIs often think:
“I bought at Rs 50 lakh, now it’s Rs 1 crore — I doubled my money.”
But in USD terms:
Rs 50 lakh (at Rs 50 per USD) ≈ USD 100,000
Rs 1 crore (at Rs 100 per USD) ≈ USD 100,000
So after many years, the “doubling” in rupees may just be currency illusion.
When It Still Makes Sense:
It works financially only if:
The asset grows well beyond two times over long periods (ideally 3x–4x or more)
It still makes sense regardless of returns if:
You plan to return to India
You want family/security/social roots
You want diversification outside USD assets
Key Point:
For NRIs, the move from around Rs 45 to Rs 95 per USD means:
Your benchmark is not “did my asset grow?”
It is “did my asset at least double?”
If not, your wealth in USD terms has quietly shrunk—even if in rupee terms it looks like a success.
Core Principle for NRIs: Separate Emotion from Financial Reality:
Investing is fundamentally about cold, objective calculations. Emotional comfort, family expectations, and a sense of belonging are real and valuable—but they are not financial returns. NRIs need to consciously separate these two worlds instead of mixing them.
Emotional Value Is Real—but Not Measurable.
Buying property or assets in India often gives peace of mind:
family feels secure, social standing improves and there is a psychological fallback option.
These are meaningful benefits. In many cases, they may even outweigh financial returns for the individual. But they cannot be measured in rupees or dollars, and they should not be mistaken for investment performance.
The Financial Reality NRIs Must Face:
From a purely financial lens, the math is unforgiving:
If Rs 47 per USD becomes Rs 95 per USD, your base currency has lost half its value.
So any asset bought in India must:
not just grow—but grow enough to overcome this currency gap.
If it doesn’t, then regardless of how good it “feels,” the investment has underperformed in USD terms.
Chart 183 click on the image to view better >
--------------------------------------------------------------
Update 20Mar2026: Chart 182:
FPI Equity Flows to India: India
FPI Flows to Indian stock market, DII Flows to Indian stock market and
Individual Investor flows to India stock market - both in rupee terms as
well as dollar terms - calendar-year wise data from 2013 to 2026 > (old blog 10Jul2022) >
Comparing CY 2025 with CY 2026 (both based on the first 2 months):
FPIs: Outflows are much smaller in 2026 (-1.5 billion USD) versus heavy selling in 2025 (-13.0 billion USD). This suggests foreign selling pressure has sharply eased in 2026.
However, in March 2026, with only six trading sessions remaining, FPI selling has accelerated sharply, with net outflows already reaching about USD 9.5 billion.
DIIs: Slightly lower in 2026 (11.9 billion USD) compared to 2025 (17.5 billion USD), but still strong and clearly positive. Domestic institutions continue to provide steady support, though at a slightly reduced pace.
Individuals: Noticeably weaker participation in 2026 (1.0 billion USD) versus 2025 (3.2 billion USD). Retail inflows have cooled meaningfully.
Overall: FPI selling in Indian stock market continues to be heavy in calendar year 2026 too. DIIs have been providing support to the market, though at a reduced pace compared to first two months of 2025.
Individual interest in 2026 has dwindled compared to the first two months of 2025.
In
the past five years, FPIs net outflow from Indian stocks is nearly USD 10.8 billion (Rs 90,000 crore); whereas DIIs net inflows in the same period are USD 222.9 billion (Rs 18.61 lakh
crore).
FPIs are foreign portfolio investors.
DIIs are domestic institutional investors.
According
to NSE India, DIIs include Banks, Insurance companies, Mutual Funds,
Domestic Financial Institution (Other than banks & insurance),
Domestic Venture Capital Funds, AIFs, PMS clients, New Pension System
(NPS) and NBFCs.
Individual
investors data for NSE secondary market only. Individuals include
individual /proprietorship firms, HUF (Hindu Undivided Family) and NRIs
(Non resident Indians).
Chart 182 click on the image to view better >
--------------------------------------------------------------
Update 18Mar2026: Charts 180 and 181:
FPI AUC data: FPI / FII AUC data: Assets under custody (AUC) data of foreign portfolio investors (FPIs): the two charts below are:
FPI equity assets - Quarterly data (past 12 quarters)
FPI debt assets - Quarterly data (past 12 quarters)
(for old data > Old blog dated 10Jul2022 - Exit India Policy by Foreign Investors; and old blog dated 28Apr2022 - Foreigners' Shrinking Pie in Indian Equities)
FPI
equity assets, as on 28Feb2026, are Rs 71.8 lakh crore, as compared to Rs 74.3 lakh crore on 31Dec2025.
FPI equity assets were USD 789 billion as on 28Feb2026, showing a decline of USD 36 billion compared to data as at end-Dec2025. This is due to fall of Indian indices and FPI selling between end-Dec2025 and end-Feb2026.
A
combination of heavy FPI outflows and Nifty 50 decline resulted in
share of FPI equity assets (FPI equity AUC) falling from 16.4 per cent (as a percentage of total market cap of
all BSE listed firms) in Sep2024 to 15.5 per cent in Feb2026.
FPI investors have been losing interest considerably in Indian stocks in the past four years -- their share has come down
from almost 20 per cent in Mar2021 to below 16 per cent now; domestic
investors' share has been rising gradually during the period.
In the charts below for equity AUC, you could find data relating to equity AUC in rupees and dollars, year-on-year percentage change in equity AUC in dollar terms, Nifty 50 level, year-on-year percentage changes in Nifty 50 and the US dollar - Indian rupee exchange rate.
FPI debt assets, as on 28Feb2026, are Rs 7.2 lakh crore, as compared to Rs 7.1 lakh crore on 31Dec2025.
FPI
debt assets were USD 79.3 billion as on 28Feb2026, showing stagnation in the past four to five months. As can be seen in the chart
attached below, the growth rates of debt assets have fallen during
2025, though total assets are growing.
Debt assets at USD 79.3 billion are nearly one-tenth of equity assets (USD 789 billion) as of 28Feb2026.
To a mild extent, the huge outflows of FPIs in equity segment have been compensated by inflows into debt segment.
In the charts for debt assets, you could find data relating to debt AUC in rupees and dollars, year-on-year percentage change in debt AUC in dollar terms, 10-year G-Sec yield and the US dollar - Indian rupee exchange rate.
Total
assets (including equity and debt) in India held by forign
portfolio investors (FPIs) as on 28Feb2026 are USD 868 billion as
compared to USD 1 trillion achieved as of 30Sep2024.
Charts 180 to 181 click on them to view better >
--------------------------------------------------------------
Update 15Mar2026: Charts 178 and 179:
Shipping trade data through Strait of Hormuz and Suez Canal (near Red Sea): Shipping traffic data through Strait of Hormuz and Suez Canal - Recent Trade Disruptions: International Trade Data:
Strait of Hormuz: Trade volumes through the Strait of Hormuz were within the normal historical range of about 2.6 to 3.7 million metric tonnes between 2023 and 2025.
By 28Feb026, the 7-day moving average trade volume had risen to about 4.07 million metric tonnes, indicating strong shipping activity.
But after the US - Israel joint war against Iran began on 28Feb2026, international trade through the Strait of Hormuz rapidly collapsed since 01Mar2026.
By 08Mar2026 trade volumes fell to only about 0.07 million metric tonnes, representing roughly a 98 percent drop within a week.
This data indicate that commercial shipping through the Strait of Hormuz has effectively come to a near halt due to the Third Gulf War.
The Strait of Hormuz is one of the most critical chokepoints in global trade because it is the main maritime gateway for exports from the Persian Gulf. Roughly one-fifth of the world’s crude oil and a large share of liquefied natural gas (LNG) shipments pass through this narrow waterway each day.
Any disruption to shipping in the strait can quickly affect global energy supply, transport routes and international trade flows.
Suez Canal (near Red Sea): The Suez Canal is another systemically important shipping lane that carries about 15 percent of global maritime trade and connects Europe and Asia through the Red Sea.
Before disruptions began, trade volumes through the canal were strong, with the 7-day moving average reaching about 3.42 million metric tonnes in mid-Dec2023.
However, attacks on commercial vessels in the Red Sea near the Bab el-Mandeb Strait starting on 16Dec2023 significantly disrupted shipping in the region. As a result, many shipping companies avoided the route and rerouted vessels around the Cape of Good Hope, leading to a sharp decline in trade flows through the Suez Canal.
By 20Nov2024, the 7-day moving average trade volume had dropped to about 1.02 million metric tonnes, representing a decline of 70 percent compared with the mid-Dec2023 level.
Trade volumes remained relatively low through 2025 but began to recover gradually as attacks from Houthi rebels in Yemen decreased.
By 03Mar2026, the trade volume had risen to about 1.59 million metric tonnes, though this was still around 53.4 percent lower than the level recorded before the disruptions began.
The Suez Canal and Bab el-Mandeb Strait faced major disruptions starting mid-Dec2023 due to attacks on commercial ships, in the Red Sea, by Houthi rebels.
The Houthis carried out attacks on commercial ships to retaliate against Israel and its allies and to assert leverage amid the Israel–Hamas war.
data sources:
Charts 178 and 179 click on the image to view better >
--------------------------------------------------------------
Update 04Mar2026: Charts 176 and 177:
FPI Equity Flows to India: India
FPI Flows to Indian stock market and debt market in rupee terms > (old blog 10Jul2022) >
Jan2026 experienced one of the heaviest FPI selling months for equity markets in India, with FPIs net selling amountng to nearly Rs 36,000 crore, though they turned positive in Feb2026 with inflows of Rs 22,600 crore.
FPI debt flows are a saving grace for India, especially in the past three years. During Jan2026 and Feb2026, debt flows by FPIs were positive after experiencing negative flows in Dec2025.
Significantly, in the past 12 months, nine months have seen positive debt FPI flows to India.
FPIs are foreign portfolio investors.
Two charts >
India FPI equity flows monthly (15 months)
India FPI debt flows monthly (15 months)
Charts 176 and 177 click on the image to view better >
--------------------------------------------------------------
Update 22Feb2026: Charts 174 and 175:
US Dollar Sale and Purchase by Reserve Bank of India: RBI USD Sale and purchase: RBI forex intervention / currency intervention: (old blog dated 05Aug2021 with monthly and yearly data for several years -- see also update 24Dec2025 with charts 150 and 151 below)
Two
charts showing monthly and quarterly data of USD sales and purchases by
RBI > Data avilable only till 31Dec2025 as RBI releases official
data on currency intervention with a two month gap >
Between Jun2025 and Dec2025, RBI has been net seller in all seven months,
with total net sale amounting to USD 53.4 billion, in order to defend a depreciating rupee (see charts below).
Despite the heavy RBI forex intervention, the rupee weakened by 4.94 per cent against the dollar during the same period, falling from 85.48 at end-May2025 to 89.92 by end-Dec2025.
Over these seven months (Jun-Dec2025), India’s foreign currency assets (FCA) declined by USD 24.6 billion - significantly lower than the RBI’s net dollar sales of USD 53.41 billion.
Possible reasons for lower reduction in FCA compared to RBI's net sales of US dollars:
The RBI’s net dollar sales of USD 53.41 billion reduced reserves mechanically, but FCA is marked-to-market, not a simple cash balance.
Valuation gains: from a weaker US dollar against other reserve currencies and/or rising global bond prices — likely lifted the USD value of non-dollar assets (denominated in Japanese Yen, Pound Sterling or Euro).
As a result, these positive valuation effects offset part of the intervention impact, keeping the FCA decline (USD 24.6 billion) well below net sales.
The RBI earns significant interest income from US Treasuries and foreign sovereign bonds, which constantly injects new capital back into the FCA.
The net sales figure includes future commitments (forward contracts), whereas the FCA only reflects actual cash movements and settled transactions.
Between end-May2025 to end-Dec2025, the US dollar
gained 5.2 per cent versus the Indian rupee -- conversely, INR lost
4.94 per cent vs the USD.
Since the start of 2025, rupee has been
volatile. It even appreciated to a level of 84 during the first week of
May2025.
Even
though, US dollar index (DXY), a guage of USD versus six major
currencies, had fallen only 1.2 per cent between end-May2025 and end-Dec2025, rupee has been under
pressure due to Trump tariffs, FDI slowdown and FPI heavy selling in Indian stock markets.
Charts 174 and 175 click to view better >
--------------------------------------------------------------
Update 27Jan2026: Chart 173:
RBI Gold Holdings as at the end of Nov2025: RBI
gold reserves are part of India's forex reserves maintained by RBI on
behalf of Government of India >
References:
Central Banks Fuel Gold Speculation, Risking Pain for Ordinary People 23Dec2025
Who is Eating my gold ETF return? 25Jan2022 (updates 20Jan2025 and other latest ones are available -- recency bias)
For more on RBI gold holdings, see blog dated 07Mar2022
Gold’s 2025 Rally Is Not a Central Bank Story:
As of 27Jan2026, gold has shattered records, recently crossing the historic USD 5,000 per troy ounce mark.
Central banks are not the marginal buyers setting gold prices, even though they matter for long-term credibility.
In calendar year 2025, global central bank gold buying slowed (compared to CY 2024). And, India's central bank, Reserve Bank of India (RBI), added only about 4 tonnes, which confirms they were not driving the rally (see chart below). Central banks buy slowly, often off-market.
Based on the purchases data, one could safely surmise that RBI took a strategic decision not to add anything further to its gold reserves, once international gold price crossed USD 2,800-3,000 per ounce level in Dec2024-Jan2025.
One caveat: While some central banks, notably China, may under-report or delay disclosure of gold purchases, available data suggest official buying was not the marginal driver of gold prices in 2025.
Gold prices move mainly on financial demand, not on slow-moving official central bank accumulation.
Since mid-2025, ETF (exchange traded fund) inflows, futures positioning and trend-following funds turned decisively bullish and pushed prices higher.
A few billion dollars of financial inflows can move gold prices far more than tens of tonnes of central bank purchases.
At the same time, markets may be pricing in weaker growth and falling real interest rates, which is historically the strongest driver of gold.
Private investors and institutions increased gold exposure as a hedge against currency risk, sanctions risk and portfolio volatility.
Geopolitical risks are adding a persistent risk premium to gold.
Ongoing but slower central bank buying provided a downside floor, encouraging speculative and leveraged long positions.
Poland central bank’s announcement that it plans to add 150 tonnes of gold, on top of its existing 550-tonne holdings, is a long-term strategic signal rather than evidence of near-term demand.
With no specified timeline, such purchases are typically spread over years and often executed discreetly, making them unlikely to drive sharp price moves.
These announcements mainly reinforce a downside floor for gold by validating official-sector support, but they do not explain the rapid price acceleration since mid-2025.
In short, the 2025–26 gold rally is being driven by financial investors and macro expectations, not by central banks.
Gold surge driven by currency debasement?
One of the strongest arguments propounded by gold investors is the currency debasement. In simple terms, debasement is the "hidden" erosion of a currency’s value caused by, ultra-loose monetary policies, excessive money printing and high government debt.
Government debt has gone up substantially over the years, especially, after the 2007/2008 Global Financial Crisis (GFC). Post-COVID fiscal stimulus in the US and Europe, funded by money creation, reinforced fears of long-term dilution of fiat currencies.
Rising and arguably unsustainable public debt levels in the US, Japan and Europe have further amplified the currency debasement concerns.
But what about bond markets and currencies?
Inflationary expectations currently are low. Bond yields also do not reflect any excessive stress from inflationary or geopolitical concerns (except in Japan, where bond yileds are rising recently driven more by political and fiscal uncertainty).
Inflation expectations remain relatively low, weakening the classic argument for gold as a pure inflation hedge. If inflation is not the driver, investors must ask what risk gold prices are actually signaling.
One interpretation is that markets are pricing in the possibility of major geopolitical conflict. Yet much of the global stress has not fully surfaced in sovereign bond markets or major currencies. The dollar index is down roughly 11 percent over the past year but is broadly unchanged over the past decade despite significant volatility.
This
points to short-term dollar weakness rather than an outright collapse
of the currency system. The gap between relatively stable long-term
currency trends and surging gold prices suggests fear of future regime
shifts rather than present-day data.
Sceptics of the debasement theory argue that gold’s recent surge is driven more by temporary speculative mania and geopolitical jitters than a permanent collapse of the monetary system.
Furthermore, history shows that central banks have successfully used interest rate hikes and quantitative tightening to tame inflation in the past, proving that fiat systems may be more resilient than gold enthusiasts suggest.
Ultimately, viewing gold as a diversified insurance policy rather than an inevitable replacement for currency helps temper the extreme narratives often found in the market.
Investors need to do some critical thinking:
What are the second-order and third-order effects of gold and silver prices reaching new all time highs (ATH) every day?
Will sovereign governments sit on their hands while their monetary sovereignty is threatened relentlessly?
Chart showing calendar year gold holdings of RBI, yearly growth and growth in per cent - world gold price is added to guess at what price RBI bought gold >
Chart 173 click to view better >
--------------------------------------------------------------
Update 22Jan2026: Charts 171 and 172:
India FDI flows: Foreign Direct Investment flows : Gross FDI flows and net FDI flows data (old blog 25May2022, Tweet thread 25May2022, Tweet thread 19Jan2024 and Tweet thread 16Jun2025 >
(see Update 08Sep2025 with good analysis)
(see Update 16Jun2025 with charts 91 and 92 below)
Net foreign direct investment (FDI) Flows to India: Net FDI rebounded sharply in the first 8 months of FY 2025-26 (see chart below for data):
A. Gross FDI to India:
Gross FDI to India rose to USD 64.7 billion in the first 8 months of financial year 2025–26, up 16.1 per cent over the same period last year.
This suggests renewed foreign investment interest at the entry level -- some of the growth is from huge foreign ownership interest in India's financial sector in 2025.
Mar2025: Singapore's Temasek takes 10% stake in India's Haldiram's for USD 1 billion. A few weeks later, Haldiram sold part stakes to IHC and Alpha Wave Global.
Global technology giants pledges:
US tech giants announced a lot of investmetns in India, such as:
> Amazon Inc / AWS committed investments of USD 35 billion by 2030 in cloud / AI infrastructure > Google / Alphabet to invest USD 15 billion in AI hub (data centre) in Visakhapatnam
These commitments suggest a strong pipeline of FDI inflows to India in the next five years.
B. FDI Repatriation / disinvestment declined but remains structurally high:
FDI repatriation fell 4.2 per cent year-on-year to USD 37.0 billion, indicating some easing of exit pressure. However, the absolute level remains large, confirming that private equity (PE) and venture capital (VC) exits and disinvestments are a dominant feature of India’s FDI cycle.
FDI repatriation mainly refers to the withdrawal of equity investments, including the return of invested capital, proceeds from selling shares and repatriation of reinvested earnings.
Foreign multinational companies (MNC) selldowns in Indian stock market in 2024 include: Hyundai Motors India (USD 3.3 bn IPO), BAT in ITC (USD 2.0bn), Whirlpool in its India arm (USD 0.5bn), Timken, Singtel-Bharti Airtel, Vodafone-Indus Towers and ZF Com Veh Control Systems India.
FDI repatriations in 2025: LG Electronics India (via USD 1.7 billion IPO) and PE firms exiting via IPOs of Lenskart Solutions, Meesho Ltd and Pine Labs.
IPO boom as an exit accelerator for foreign investors:
The roaring IPO market in India during 2024–25 and 2025–26 has likely acted as a powerful enabler of FDI repatriation, especially for PE and VC investors seeking public-market exits.
While not the sole driver, strong IPO valuations and deep domestic absorption have made it easier to monetise earlier FDI investments and repatriate capital.
C. FDI to India improved sharply from a low base:
FDI to India (gross minus repatriation) jumped 61.6 per cent to USD 27.7 billion. This improvement is driven more by lower repatriation than by a surge in fresh inflows, highlighting that FDI is highly sensitive to exit behaviour.
D. Outward FDI by Indian firms also accelerated:
FDI by India increased 34.9 per cent to USD 22.1 billion, reflecting stronger overseas investment by Indian corporates. This offsets a significant portion of inbound FDI.
Outward FDI by Indian firms include (some of them are yet to fructify):
> Tata Motors acquires Iveco (Italian truck maker) for USD 4.45 billion (final closing is subject to regulatory / funding approvals)
> Bharti Airtel's parent company, Bharti Global, invested USD 4 billion to acquire a 24.5% stake in BT Group
> Sun Pharma invested USD 829 million into its Netherlands subsidiary and has successfully acquired Checkpoint Therapeutics
> Dec2025: IT services giant TCS Ltd acquires 100% stake in US-based Coastal Cloud for USD 700 million
> Oct2025: Lupin Ltd announces plan to build a manufacturing plant in Coral Springs, Florida, USA at a cost of USD 250 million
> Aug2025: Zydus Wellness Ltd, a subsidiary of Zydus Lifesciences, on 29Aug2025 announced acquisition of UK-based Comfort Click Ltd (CCL) for a cash consideration of USD 320 million
E. Net FDI remains modest despite sharp percentage growth:
While the past three financial years (FY2023 to FY2025) have been a disaster (check the yearly data chart given below), net FDI flows to India stands at only USD 5.6 billion, though up more than seven times year-on-year due to a very low base last year.
Macro takeaway—FDI headline strength masks underlying churn:
The data show a high-churn FDI regime: strong gross inflows coexist with heavy repatriation and rising outward FDI.
For foreign exchange markets and the rupee, this means limited net dollar support despite healthy-looking gross FDI numbers.
Additional data:
PE exits from India in USD billion as per EY report:
22.2 in Jan-Jul2025
28.1 in 2024
24.9 in 2023
18.3 in 2022
39.6 in 2021
6.0 in 2020
Two charts showing gross FDI, FDI repatriation, FDI to India, outward FDI by India and net FDI flows: Data from 2006-07 to 2025-26 >
Data: RBI DBIE and author
Chart 171 click on the image to view better >
Chart 172 click on the image to view better: data from 2006-07 to 2025-26 >
--------------------------------------------------------------
Update 16Jan2026: Chart 170:
FPI Equity Flows to India: India
FPI Flows to Indian stock market, DII Flows to Indian stock market and
Individual Investor flows to India stock market - both in rupee terms as
well as dollar terms - calendar-year wise data from 2013 to 2025 > (old blog 10Jul2022) >
After
a gap of six years, individual investors turned negative (data up to
31Dec2025) in calendar year 2025. DIIs invested a record USD 89.6 billion (Rs 7.81 lakh
crore) in Indian equities in CY 2025.
Whereas,
FPIs exited Indian stocks worth USD 18.9 billion (Rs 1.66 lakh crore) in 2025, more than full calendar year outflows in 2022. Going by the past trend, FPIs
may turn positive in 2026 subject to a win-win trade deal between India
and the US, rupee stabilising and other factors.
In
the past five years, FPIs net outflow from Indian stocks is nearly USD 10.8 billion (Rs 90,000 crore); whereas DIIs net inflows in the same period are USD 222.9 billion (Rs 18.61 lakh
crore).
Calendar year 2025 data are upto 31Dec2025 (full year).
FPIs are foreign portfolio investors.
DIIs are domestic institutional investors.
According to NSE India, DIIs include Banks, Insurance companies, Mutual Funds, Domestic Financial Institution (Other than banks & insurance), Domestic Venture Capital Funds, AIFs, PMS clients, New Pension System (NPS) and NBFCs.
Individual
investors data for NSE secondary market only. Individuals include
individual /proprietorship firms, HUF (Hindu Undivided Family) and NRIs
(Non resident Indians).
Chart 170 click on the image to view better >

--------------------------------------------------------------
Update 11Jan2026: Chart 169:
MSCI EM Index - China and India weights: Quarterly changes between Dec2024 and Dec2025: (for old data, see old blogs dated 07Jan2023 and blog 03Aug2021 and previous charts below)
India's position in the MSCI EM Index continues
to be in third rank, as India has been underperforming grossly since
the beginning of 2025. China and Taiwan continue to dominate the index
as of 31Dec2025.
Overview of MSCI EM Index (as of 31Dec2025)
The MSCI Emerging Markets Index remains broad-based with 24 countries and just under 1,200 securities. Market capitalisation has risen sharply to about USD 10.2 trillion, reflecting both price appreciation and currency effects versus 2024 and early 2025.
Valuations have moved higher but are still moderate by historical EM standards.
Index Size and Breadth
The number of countries has been stable at 24 across all periods shown. The number of securities declined from 1,252 at end-2024 to 1,197 by end-2025, suggesting ongoing consolidation, delistings or stricter inclusion criteria.
Market Capitalisation Trend
Market cap increased from USD 7.7 trillion at end-2024 to USD 10.2 trillion by end-2025. This is a strong recovery and expansion phase for EM equities.
After a gap of four years, MSCI EM index outperformed MSCI World index in calendar year 2025 -- with MSCI EM index delivering 30.6 per cent return versus 19.5 per cent for MSCI World.
Valuation Metrics and Income
Forward P/E ratio rose from 11.9 at end-2024 to 13.5 by end-2025. Price-to-book increased from 1.8 to 2.2 over the same period.
These moves show clear valuation re-rating, though EM valuations remain below developed-market levels. Dividend yield has declined from about 2.6 percent to 2.3 percent, reflecting higher prices rather than weaker dividends.
Country Weights: Concentration and Shifts
China remains the dominant country but its weight fell to 27.6 per cent from peaks above 31 percent earlier in 2025. Taiwan’s weight increased to 20.6 per cent, reflecting strength in semiconductors.
India stands at 15.3 per cent, lower than its Dec2024 peak, but still structurally higher than in prior years.
South Korea's share increased to around 13 per cent, led by technoogy companies. Brazil continues to be the largest Latin American exposure at just over 4 per cent.
Overall, the top three countries account for more than 60 percent of the index, highlighting concentration risk.
Company Weights: Technology Dominance
TSMC is the single most important constituent at nearly 12 per cent, significantly higher than a year earlier. Tencent remains the second-largest holding at just under 5 per cent. Samsung, Alibaba and SK Hynix round out the top five.
Technology and related hardware dominate the index leadership, reinforcing the EM index’s sensitivity to the global semiconductor and China tech cycles.
India has only two companies in top 10, namely, HDFC Bank (rank 6th) and Reliance Industries ( rank 7th).
Key Implications for Investors
The index shows a clear valuation re-rating in 2025 alongside strong market cap growth, led by large-cap technology and North Asian markets.
Concentration risk remains high, particularly in TSMC and China–Taiwan exposure. Dividend income is becoming less attractive as prices rise.
Overall, EM appears to be in a cyclical upswing rather than a deep value phase, with returns increasingly dependent on earnings delivery and global tech demand rather than multiple expansion alone.
Click on the chart to view better >
--------------------------------------------------------------
Update 10Jan2026: Charts 166 to 168:
Major Foreign Holders of US Treasury Securities:
Three charts here are:
1. Top 20 Countries Holding US Treasuries:
2. India's Holdings of US Treasury Securities:
3. Comparing RBI holdings of US Treasuries, Foreign Currency Assets and Gold: Diversification Strategy of RBI Forex Reserves:
According
to the data published by the US Treasury, the total holdings of US
Treasury Securities held by all foreign residents are USD 9,243 billion
as at the end of Oct2025.
There
is an increase of USD 549 billion or 6.3 per cent, of US Treasury
holdings by foreign entities, versus a year ago. See Chart 1 below.
Japan
continues to be the biggest holder of US treasuries with holdings of
USD 1,200 billion, followed by the UK (878), China (689), Belgium (469) and Canada (419). The share of these top five countries in total
holdings are 13, 9.5, 7.5, 5.1 and 4.5 per cent respectively as at the end of Oct2025.
US Treasury Securities held by Foreign Residents:
As
of Oct2025, the US Treasury Securities held by Foreign Residents are
USD 9,243 billion. Of these, USD 3,880 billion are held by Foreign
Official sources and the remaining USD 5,363 billion are held by foreign
private entities.
Foreign Official Holdings: This
includes the holdings of foreign governments, central banks (like the
BoE, BoJ, PBOC, RBI) and other official institutions (like sovereign
wealth funds).
Foreign Private Holdings: This includes all other foreign investors. This is a very diverse group and includes:
Foreign commercial banks,
Foreign corporations,
Foreign pension funds and insurance companies,
Individual foreign investors, and
Other private entities and investment funds.
India holdings of US Treasury Securities:
As of Oct2025, India's holdings are USD 190.7 billion, compared to USD
241.4 billion as of Oct2024, a year on year fall of nearly 21 per cent. Indeed, this is a steep fall.
Of the total foreign holdings of US
Treasuries of USD 9,243 billion, India's share is 2.1 per cent now
compared to 2.8 per cent a year ago. Even in percentage terms, India's share has fallen significantly.
It may be noted India's central bank, RBI, holds offficial forex reserves on behalf of Government of India.
Proper perspective on India's UST holdings:
Past one year data on US Treasury holdings by India have been volatile. Recent peak for India's holdings of US Treasurys was USD 247.2 billion as at end of Sep2024.
From USD 241 bn in Oct2024, the holdings fell to USD 219 bn by Dec2024, but rose to USD 240 bn by Mar2025. In Apr2025, the holdings fell but rose in May2025, but declined again in Jun2025.
So, there is no clear pattern of selling or buying (here, we've not analysed the movement in the underlying dollar values of US Treasuries, which have seen dramatic volatility in recent years).
From Jun2025, the decline is sharp, with holdings falling every month till Oct2025. The holdings fell from USD 227 bn in Jun2025 to USD 191 bn in Octe2025.
We'are only analysing data of US Treasuries. We
don't know what the RBI holdings in sovereign bonds of other countries
are. For example, does RBI hold any sovereign bonds from the UK, France,
China, Brazil, Japan, South Africa or Nigeria for that matter?
One
needs to analyse the data dispassionately. It seems Indian media come
to the conclusion first and then present the data to suit their
conclusions, without considering the long term data or other connected
areas.
A corporate media yesterday published an article saying "India's UST holdings down by 21%, first time in four years." While this data point is correct, they fail to give a proper perspective to the sharp fall in holdings.
Media focus on recent quarters might exaggerate concern by not acknowledging the volatile holdings in the past one year.
In this context, we need to ask three basic questions?
One is why are India's UST holdings falling. Number two is whether the holdings of Treasuries of other countries are falling. And the third is whether the share of UST is falling in relation to India's foreign currency assets (FCA).
We don't know the answers to the first two questions because the RBI does not give any data on this. We can only speculate on the reasons. But we can definitely provide some context.
The proper context: Let us take the period of recent sharp fall in UST holdings, that is, between Jun2025 and Oct2025.
Between end-Jun2025 and end-Oct2025, India's UST holdings fell from USD 227.4 bn to USD 190.7 bn, a fall of USD 36.7 bn. How does the fall compare with India's FCA?
Between end-Jun2025 and end-Oct2025, India's foreign currency assets (FCA) fell by USD 30.2 bn from USD 594.8 bn to USD 564.6 bn. The share of UST in FCA fell form 38.2 per cent to 33.8 per cent (chart 3 below).
Why have FCA fallen? Because RBI has been selling dollars in the past four months.
How much dollars RBI has sold in four months upto Oct2025? It's a staggering USD 30 billion. This matches with the decline in UST holdings of RBI in the same period.
By the way, why is RBI selling dollars? Because RBI is defending the rupee (from falling too much) by selling dollars from its holdings of FCA.
When you want to sell your assets, which assets will you sell the most? In general, you will sell securities / assets that are most liquid.
This is exactly what RBI has been doing. They have been selling US dollar assets to defend the weakening Indian rupee. Because US Treaury securities are the most liquid assets in the world.
So,
India's central bank, the Reserve Bank of India, has no choice but to
sell the most liquid securities in its holdings, that is, the US
Treasuries.
The entire focus is on forex reserves, not on foreign currency assets (in the same period, forex reserves were up from USD 668 bn to USD 690 bn, due to rise in gold holdings driven by surging gold prices internationally).
(Note: The correct metric to use here is not forex reserves, but foreign
currency assets (FCA). India's forex reserves consist of foriegn currency
assets, gold holding and SDRs or special drawing rights.)
Now, let us come to the third question: How do you compare UST holdings to India's forign currency assets?
As mentioned above, the correct metric to use here is not forex reserves, but foreign
currency assets (FCA).
India's forex reserves are increasingly dominated by gold, hence let us use the FCA metric to compare with India's UST holdings (chart 3 below).
From Mar2022 to Oct2025, UST holdings declined from USD 199.8 billion to 190.7 billion,
while the their share in FCA declined significantly from
37 per cent to 33.8 per cent in the same period. But the UST holdings' share has been volatile in the past five years (chart 3 below).
This isn’t a divestment in absolute terms (holdings remain high), but a relative decline due to:
Gold price surge
Broader reserve accumulation
Possible currency diversification
Essentially, you need to link the fall in RBI's US Treasury holdings to the decline in the RBI’s foreign currency assets (FCA) and the quantity of net US dollar sales from forex intervention.
Without connecting these dots, the macro picture remains incomplete. 😃
Bonus data point: India's foreign currency assets (FCA) have
fallen between Mar2025 and Oct2025 from USD 567.6 billion to USD 564.6
billion. Nobody will tell you that. 😀
Diversification strategy of forex reserves by RBI:
Of course, the Reserve Bank of India (RBI) has been diversifying its forex reserves
in recent years. This is more pronounced since the outbreak of
Russia-Ukraine war in Feb2022. Since the outbreak of Russia-Ukraine
war, RBI holdings of US Treasury Securities have fallen from USD 200 bn to USD 191 bn now.
The value of RBI gold
holdings (due to a combination of sharp rise in dollar gold price
internationally and new physical gold bought by RBI) has increased over
the years and the share of gold reserves in total forex reserves too
has risen.
Significantly,
RBI has not practically bought any physical gold between Mar2025 and Oct2025. Its gold holdings remained stagnant at 880 metric tonnes in the
current financial year (chart 3 below).
However,
the market value of its gold holdings increased from USD 78.2 billion
in Mar2025 to USD 101.7 billion by Oct2025, as the gold has been reaching
all time highs recently (chart 3 below).
The share of market value of gold reserves in forex reserves has
increased steadily between Mar2020 (6.4%) and Oct2025 (14.8%), with value
increasing from USD 30.6 billion (physical gold hlding 653 million tonnes) to USD 101.7 billion (880 mt) -- but the increase is more pronounced since the start
of Russia-Ukraine war.
The value and share of gold holdings are climbing more rapidly, while the share of UST has declined sharply.
This reflects:
Price appreciation of gold (more than 75% rise in three years).
Buying of more physical gold by RBI over the years.
RBI's strategic allocation away from dollar-based assets.
Geopolitical risk hedging by RBI post-Russia-Ukraine war.
data sources:
Table 3: US Treasury Securities held by Foreign Residents
Three charts >
--------------------------------------------------------------
Update 03Jan2026: Charts 164 and 165:
Global market data: Global market data pertaining to stocks, bonds,
commodities and currencies are presented here. The data points are yearly changes and compounded returns from 2015 to 2025, indicating how the values have moved over the years. (old blog dated 12Jan2024 - global market data 2013 to 2023).
(See Update 04Jan2025 with charts 47 to 49)
The
stock market data presented in the table are price returns (not
including dividends) and they are in local currency terms.
Two charts here:
> Global market data: Yearly changes from 2015 to 2025
> Global market data: Compounded annual returns for 3-year, 5-y, 7-y and 10-y periods as at the end of 31Dec2025
You
can find out how the assets classes and currencies have moved over the
years. These charts reveal the cyclical nature of the returns in global
financial markets.
GLOBAL SNAPSHOT 2015–2025
All the analysis is as of 31Dec2025.
The two exhibits together show a decade that splits cleanly into three regimes: a pre-2020 expansion, a 2020–22 shock-and-whipsaw period, and a post-2022 normalisation with higher inflation and rates.
Returns are far more uneven than the headline averages suggest, with the US and India compounding strongly, Europe middling, and China/Hong Kong lagging badly. Volatility, not just growth, is the defining feature of the period.
EQUITIES: WHO WON THE DECADE
US equities dominate on compounding power. The Nasdaq is the standout on every horizon, reflecting the sustained outperformance of growth and technology sectors; the S&P 500 is a strong second.
India is the other clear winner: Nifty 50 and especially BSE MidCap show decent multi-year compounded returns (CAGR), pointing to a long domestic growth cycle plus multiple expansion.
Europe (FTSE 100, DAX 40) delivers modest long-term returns with sharp drawdowns, while Japan does better than Europe but still trails the US and India.
China and Hong Kong are the big laggards: despite occasional strong single years, their 5- to 10-year CAGRs are low to weak, indicating structural and policy headwinds overpowering cyclical rebounds.
EQUITIES: PATH MATTERS MORE THAN AVERAGES
The yearly change chart shows violent reversals: deep equity losses clustered in 2018, 2020 (select markets), and especially 2022, followed by sharp rebounds in 2023–25.
Markets with strong long-term CAGRs (Nasdaq, India MidCaps) also endured some of the worst single-year drawdowns, underscoring that endurance, not timing, drove success.
BONDS AND RATES: THE LOST DECADE FOR DURATION
Bond yields tell a clear story: the long downward trend ended decisively. Over 3-, 5-, 7- and 10-year horizons, the US Treasuries show large upward moves in yields, meaning negative price returns for long-duration bonds.
The worst damage is concentrated in the 2021–22 inflation shock, with only partial relief afterward.
The US Bonds failed as a volatility hedge in this cycle, breaking a key assumption of the prior decade.
India bonds too suffered during the inflation shock period of 2021 and 2022, but recovered later (When bond yields rise, bond prices drop and vice versa).
While US 10-year Treasury note yield rose by 271 basis points (1 percentage point equals 100 basis points); the India 10-year benchmark yield declined by 117 basis points in the past 10 years -- indicating divergent trends.
COMMODITIES: REAL ASSETS REASSERT THEMSELVES
Gold and silver show strong long-term CAGRs, reflecting inflation hedging, currency debasement fears and crisis demand. Energy is far more cyclical: crude oil has poor 3-year CAGR but acceptable 10-year returns, illustrating boom-bust dynamics rather than steady compounding.
Broad commodity indices sit in the middle, benefiting from the post-pandemic inflation burst but lacking the sustained momentum of precious metals.
BITCOIN: EXTREME RETURNS, EXTREME PATH
Bitcoin’s long-term CAGR dwarfs every other asset, but the yearly data reveal repeated crashes of 60–70 per cent plus. The message is binary: extraordinary wealth creation for holders who survived multiple near-death drawdowns, and total unsuitability for investors needing stability or predictable income.
It behaves more like a high-volatility venture asset than a currency or commodity.
CURRENCIES: DOLLAR STRENGTH AS A GRAVITY FORCE
Currency CAGRs are small compared to equities and commodities, but the pattern is consistent: the US dollar index trends stronger over most horizons, pressuring EUR and GBP.
INR depreciation is gradual and steady rather than chaotic, while JPY weakness stands out as a structural shift tied to policy divergence. Currency moves quietly but meaningfully shape real returns for global investors.
REGIONAL ROTATION AND CAPITAL FLOWS
Capital clearly favored innovation-heavy, rule-stable markets (the US) and high-growth domestic stories (India). Regions with regulatory uncertainty, demographic drag or geopolitical stress (China/Hong Kong, parts of Europe) saw capital leakage despite occasional rallies.
The data reflect not just economics, but trust, policy credibility and narrative.
PORTFOLIO IMPLICATIONS FROM THE DECADE
Diversification across assets mattered more than diversification within equities. Equities alone delivered uneven outcomes; bonds failed when inflation surged; real assets and gold provided balance; and a small allocation to extreme-growth assets dramatically altered outcomes.
The decade rewards long-term discipline, tolerance for volatility and exposure to structural growth rather than mean reversion bets.
BOTTOM LINE
2015–2025 was not a “smooth CAGR decade” but a stress test of conviction. The winners (like the so-called Magnificent 7 stocks) combined growth, policy credibility and innovation; the losers suffered from structural headwinds despite occasional strong years.
The next cycle will likely look different, but the lesson endures: compounding comes from staying invested in diversified assets with emphasis on proper asset allocation, not from wild speculation or asset / sector rotation.
--------------------------------------------------------------
Update 03Jan2026: Charts 162 and 163:
Dollar Rupee exchange rate: USD INR Exchange Rate: Calendar year-wise and financial year-wise data of the US dollar-Indian rupee exchange rate for the past 27 years (previous blog dated 03Jun2024 on Why RBI Won't Favour a Strong Rupee and preivous blog dated 01Jun2024 on how to calculate currency depreciation and appreciation) >
USD-INR yearly gain / loss
Exchange rate yearly gain / loss
Dollar rupee yearly gain / loss
USD-INR financial-year and calendar-year end data
USD-INR change %: Calendar year-wise: Dollar gain versus Rupee: Data include not only year-wise changes but also 5-year change
(annualised). For example, between end-Dec2016 and end-Dec2021, the
annualised appreciation for USD vs INR is only 1.8 per cent; whereas
between end-Dec2007 and end-Dec2012, it was 6.8 per cent annualised.
For the past 25 years, the USD has appreciated versus INR at an annualised rate of 2.65 per cent. Conversely, the Indian rupee depreciated against the US dollar at an annualised rate of 2.58 per cent.
Data range for CY-wise yearly change
for the past 27 years is: minus 1o.9 per cent to plus 22.9 per cent.
The data range is so wide one can't even predict / forecast the yearly
changes in USD-INR exchange rate.
Of
the 27 calendar years for which data are presented here, Govt of India
and Reserve Bank of India allowed the rupee to appreciate against the
dollar only on eight occasions.
INR-USD change %: (extreme right column in the table below): Column 6 shows how much the rupee has depreciated versus the dollar.
Financial year-wise: Dollar gain versus Rupee: Data include not only year-wise changes but
also 5-year change (annualised). For example, between end-Mar2020 and
end-Mar2025, the USD appreciated by 2.6 per cent annualised rate. And
between end-Mar2011 and end-Mar2016, the annualised USD appreciation vs
INR was much higher at 8.2 per cent.
For the past 25 years, USD has appreciated by an annualised 2.73 per cent versus INR.
Data range for FY-wise yearly change
for the past 26 years is: minus 11.4 per cent to plus 27.5 per cent.
The data range is so wide one can't even predict / forecast the yearly
changes in USD-INR exchange rate.
Of
the 26 financial years for which data are presented here, Govt of India
and Reserve Bank of India allowed the rupee to appreciate against the
dollar only on eight occasions.
Data for USD–INR are from RBI DBIE. All other calculations are by the author.
Explanation for two columns in the two tables presented below >
Column 3 (USD–INR change %): This shows how much the value of one US dollar changed compared to the Indian rupee during the year. A positive number means the dollar became stronger (it took more rupees to buy one dollar). A negative number shows the dollar depreciation versus rupee (dollar became weaker).
Column 6 / extreme right (INR–USD change %): This shows how much the value of one Indian rupee changed compared to the US dollar during the year. A positive number shows the rupee appreciation (one rupee could buy more dollars). A negative number means the rupee became weaker versus the dollar.
--------------------------------------------------------------
Update 02Jan2026: Charts 156 to 161:
FPI Equity Flows to India: India
FPI Flows to Indian stock market and debt market in rupee terms > (old blog 10Jul2022) >
In calendar year 2025, FPI equity flows were negative in eight months. Despite a lot of negatives, Nifty 50 managed a positive return of 10 per cent in CY 2025.
In the debt segment, the flows were better, with FPIs being net positive in nine months. However, during Dec2025, the outflows wee to the tune of Rs 0.16 lakh crore.
Cumulative FPI flows to Indian equity markets are negative in the past five years.
As on 31Dec2025: Rs lakh crore
Past one year FPI equity flows -1.66
Past two year -1.66
Past three year 0.05
Past five year -0.90
Past 10 year 2.20
FPI debt flows are a saving grace for India, especially in the past three years.
As on 31Dec2025: Rs lakh crore
Past one year FPI debt flows 0.62
Past two year 2.28
Past three year 2.94
Past five year 3.06
Past 10 year 3.32
Due to a variety of concerns, FPIs turned negative on Indian stocks, preferring markets, like, South Korea and Hong Kong (basically Chinese stocks).
Market pundits attribute the FPI exit to factors like, India "missing" AI wave of the US (Nvidia, Google, Microsoft, Broadcom and Oracle), some Chinese firms (SMIC, Alibaba and DeepSeek), South Korean firms (Samsung and SK Hynix) and Taiwan (TSMC and Foxconn).
Rupee depreciation and earnings concerns too have weighed on FPIs.
Debt segment: In CY 2025, FPIs were positive with inflows of Rs 0.62 lakh crore (lower compared to CY 2024 flows of Rs 1.65 lakh crore). Despite the positive flows, India 10-year benchmark government bond yield barely moved -- from 6.76 per cent (end-Dec2024) to 6.59 per cent (end-Dec2025).
Concerns about fiscal deficit, supply of new paper and RBI forex intervention* to defend the rupee are negative factors for the bond market.
Massive liquidity injection in the form of OMO purchases, USD INR swaps did not help. And so are Repo rate and CRR cuts.
(* when RBI intervenes in forex market by selling US dollars to defend the rupee, they suck up rupee liquidity -- this too seems to have negatively impacted bond prices)
FPIs are foreign portfolio investors.
Six charts >
India FPI equity flows monthly (15 months)
India FPI equity flows quarterly (15 quarters)
ndia FPI debt flows monthly (15 months)
India FPI debt flows quarterly (15 quarters)
India FPI flows (both equity and debt) financial year wise
India FPI flows (both equity and debt) calendar year wise
Charts 156 to 161 click on the image to view better >
--------------------------------------------------------------
Update 01Jan2026: Charts 154 and 155:
Global market data: Global market data pertaining to stocks, bonds,
commodities and currencies are presented here (old blog dated 29Jun2024).
Quarter-to-date
(QTD) global market data, as on 31st of December, 2025, of stocks, bonds,
currencies and commodities is as follows:
During Oct-Dec2025 quarter (QTD), the stand-out performance is international silver price which delivered a stunning return of 50 per cent, while gold could deliver only 11.6 per cent.
Crude oil logged 8-9 per cent losses during the quarter, while Bitcoin crashed by 23 per cent.
Among stock markets, Japan's Nikkei 225 clocked gains of 12 per cent.
One uncanny data point is: both India 10-year bond yield and US 10-year bond yield rose by one basis point (100 basis points equal one percentage point) -- with the yield spread static at 243 basis points.
Year to date: YTD, silver and gold delivered spectacular returns of 141 and 64 per cent respectively.
In stocks, Nikkei 225, Hang Seng, Dax 40, FTSE 100 and Nasdaq Composite provided superior returns.
Indian stocks are a disappointment, especially mid- and small-cap stocks.
The year-to-date (YTD) chart is also attached below.
QTD >
YTD >
--------------------------------------------------------------
Update 28Dec2025: Chart 153:
FPI Equity Flows to India: India
FPI Flows to Indian stock market, DII Flows to Indian stock market and
Individual Investor flows to India stock market - both in rupee terms as
well as dollar terms - calendar-year wise data from 2013 to 2025 > (old blog 10Jul2022) >
After a gap of six years, individual investors turned negative (data up to 30Nov2025) in calendar year 2025. DIIs invested a record Rs 7.09 lakh crore in Indian equities in 2025 (11 months).
Whereas, FPIs exited Indian stocks worth USD 16.4 billion in 2025 (11 months), almost matching full year outflow in 2022. Going by the past trend, FPIs may turn positive in 2026 subject to a win-win trade deal between India and the US, rupee stabilising and other factors.
In the past five years, FPIs net outflow from Indian stocks is nearly USD 8.3 billion; whereas DIIs net inflows in the same period are Rs 18 lakh crore.
Calendar year 2025 data are upto 30Nov2025.
FPIs are foreign portfolio investors.
DIIs are domestic institutional investors.
Individual
investors data for NSE secondary market only. Individuals include
individual /proprietorship firms, HUF (Hindu Undivided Family) and NRIs
(Non resident Indians).
Chart 153 click on the image to view better >
--------------------------------------------------------------
Update 26Dec2025: Chart 152:
India Balance of Payments (BoP): BoP data - A clarification on definitions: India
overall balance of payments - goods / merchandise exports and imports,
trade deficit, net invisibles, services exports / imports, services
trade suplus, net transfers, net income, current account deficit (CAD) and others
Update 09Jul2025 with Charts 112 and 113 - yearly BoP data for 11 years with definitions
Update 29Jun2025 with Chart 101 - yearly BoP data - 11 year BoP data with definitions
There is some confusion in the use of terms here in BoP: Terms used by general readers and IMF / World Bank.
The chart below explains some of the terms we use as a global general reader, like:
Goods exports
Services exports
Total goods exports
Goods imports
Services imports
Total services exports
A. Overall trade balance*
B. Net Transfers
C. Net Income
Current account balance# (A+B+C)
Goods trade balance
Services trade balance
Overall trade balance*
* if the overall trade balance is negative, we can call it overall trade defict; if positive, we can call it overall trade surplus
# if the current account balance is negative, we can call it current account deficit; if positive, we can call it current a/c surplus
Likeweise, whenever balance is negative, we call it deficit; when positive, we call it surplus.
Data for 2024-25 are given to get a better understanding of these terms.
References:
GTRI report: 5-year review of India's merchandise trade
Chart 152 click on the image to view better >
--------------------------------------------------------------
Update 24Dec2025: Charts 150 and 151:
US Dollar Sale and Purchase by Reserve Bank of India: RBI Forex Intervention:
Biggest Monthly Sale and Purchase of US Dollars By RBI
Chart structure: The below chart has five columns:
Month (specific month and year),
US Dollar Purchase (amount of US dollars bought by RBI in billion USD),
US Dollar Sale (amount of US dollars sold by RBI in billion USD),
Net purchase (+) / sale (-) (difference between USD Purchase and Sale indicating net buying or selling), and
USD INR exchange rate month-end level
The
table is divided into two sections showing the top eight months with
the largest net sales (negative net purchase) and the top eight months
with the largest net purchases (positive net purchase) of USD by the
Reserve Bank of India between 2000 and 2025.
Key Observations:
Biggest
Net Sale Months (Negative Net Purchase): Nov2024 saw the largest net
sale of USD at negative 20.2 billion with gross purchases of 30.9 and gross sales of
51.1 billion US dollars. Other major net sale months range between
negative 10.4 billion to negative 20.1 billion USD.
All the net USD sale figures occurred between Mar2022 and Oct2025, except Oct2008 (Lehman Bros collapse).
The
USD-INR exchange rate during these sale months ranged from about 49.25
to 88.68, with the highest exchange rate recorded in Oct2025 at 88.68.
The recent months of 2024 and 2025 show some of the largest net sales,
which indicates that the RBI was selling dollars possibly to stabilise
the rupee or manage forex reserves during periods of currency pressure.
Biggest Net Purchase Months (Positive Net Purchase):
Jun2021
had the largest net purchase at 18.6 billion US dollars, followed by
Jul2020 with 16.0 billion USD and Oct2020 with 15.6 billion USD. Net
purchases are generally lower than the biggest net sales but are still
significant, ranging from 12.1 billion to 18.6 billion USD.
The
exchange rate during these months was relatively lower compared to the
net sale months, mostly between 39.32 and 85.75. These months, mostly
between 2020 and 2025, suggest that the RBI was buying dollars to boost
reserves or counteract currency volatility.
Possible Economic Interpretations: When the RBI sells large amounts of US dollars, it is usually trying to support the rupee and stop it from falling too fast. By supplying dollars to the market, the RBI helps reduce pressure on the rupee during uncertain or volatile periods.
When the RBI buys USD in large volumes (net purchase positive),
it may be to build forex reserves or counter currency appreciation. The
data show recent years (2024-2025) have both high net sale and purchase
activity, indicating active forex market intervention by the RBI during
times of volatility.
Additional Notes:
It
may be noted absolute data should be normalised against GDP or forex
reserves for deeper analysis, meaning these raw values might not fully
reflect the economic impact without considering India’s overall economy
or foreign exchange reserves size.
The USD INR month-end level provides context on currency strength or weakness during these interventions.
Summary:
The
chart highlights the RBI’s active management of forex reserves through
large monthly USD purchases and sales. The largest net sales and
purchases mostly occur in recent years, showing dynamic currency market
intervention.
Exchange rates correlate with intervention sizes, with
bigger sales generally happening when the USD is stronger (high INR
rates), and purchases when the USD is weaker or the RBI aims to
accumulate reserves.
Chart 150 click on the image to view better >
P.S.: Update dated 24Dec2025: Normalising USD Sale and Purchase Data with Forex Reserves >
US Dollar Sale and Purchase by RBI: RBI Forex Intervention:
Biggest Monthly Sale and Purchase of US Dollars By RBI as Compared to Forex Reserves:
In the above chart of today, I shared data showing the biggest monthly sales and purchases of US dollars by the RBI. However, that chart showed only absolute figures — which can be misleading because it doesn’t account for the size of India’s forex reserves at those times.
To give you a better perspective, I’ve updated the chart by including two important parameters:
> Forex Reserves at the start of each month
> Net USD sale/purchase as a percentage of Forex Reserves
These additions help us normalise the absolute dollar amounts, showing the scale of RBI’s intervention relative to the total forex reserves available. This means we can now compare months more fairly, even if the forex reserves were very different in size.
For example, a net USD sale of USD 18.7 billion in Oct2008 represents a much larger share of forex reserves (6.5%) compared to other months with bigger absolute sales but larger reserves.
By looking at the net USD sale as a percentage of forex reserves, Oct2008—the time of the Global Financial Crisis (GFC) and Lehman Brothers collapse—stands out as the heaviest month of intervention by far.
This comparison highlights how absolute numbers alone can sometimes mask the true scale of currency interventions when the overall reserve size fluctuates greatly. Oct2008’s intervention was therefore much more impactful in proportional terms, reflecting the severity of the GFC.
This normalised view provides a clearer picture of how significant the RBI’s actions were in context, helping us better understand the dynamics of forex interventions and currency stability.
You can see the updated data in the chart below, which includes these new parameters for a more balanced analysis.
Chart 151 click on the image to view better >--------------------------------------------------------------
Update 24Dec2025: Chart 149:
US Dollar Sale and Purchase by Reserve Bank of India: RBI Forex Intervention: (old blog dated 05Aug2021 with monthly and yearly data for several years) (for quarterly chart, see Update 26Nov2025 with Charts 144 and 145)
Chart showing monthly data of USD sales and purchases by
RBI > Data avilable only till 31Oct2025 as RBI releases official
data on currency intervention with a two month gap >
Oct2025 emerged as one of the heaviest months of RBI forex intervention, marked by gross dollar sales of USD 29.6 billion against purchases of USD 17.7 billion, translating into a sizable net sale of USD 11.9 billion (the net sale figure is the highest in 10 months).
Heavy RBI currency intervention:
Between Jun2025 and Oct2025, RBI has been net seller in all five months,
with total net sale amounting to USD 33.7 billion. Net sales in the past six
months amount to USD 31.9 billion.
Over the past year (Nov2024-Oct2025), the RBI’s forex intervention has amounted to a net USD 67.4 billion sale—the highest on record in a 12-month period.
That said, absolute figures on their own can be misleading, as economies expand over time. To draw meaningful comparisons, such data should be normalised against relevant metrics such as nominal GDP, total forex reserves or similar benchmarks--and expressed in ratio terms.
Year-to-date, the US dollar
gained 4.81 per cent versus the Indian rupee -- conversely, INR lost
4.59 per cent vs the USD. Since the start of 2025, rupee has been
volatile. It even appreciated to a level of 84 during the first week of
May2025.
Even
though, US dollar index (DXY), a gauge of USD versus six major
currencies, has fallen almost 10 per cent YTD, rupee has been under
pressure due to Trump tariffs and RBI currency intervention (or lack of
intervention) strategies.
As of yesterday (23Dec2025), rupee closed at 89.63, recovering from 91.5 level reached a few weeks ago.
Compared
to Oct-Dec2024 period net sales of USD 44.7 billion and net sale of USD 33.7 billion in Jun-Oct2025 period, RBI currency
intervention has been subdued in the period between Jan2025 and May2025.
Chart 149 click on the image to view better >
--------------------------------------------------------------
Update 11Dec2025: Charts 147 and 148:
US Federal Reserve Funds Rate: Fed Funds Rate (for old data see charts below and see here) >
The US Federal Open Market Committee (FOMC) at its meeting on 10Dec025 reduced the federal funds rate (the Fed funds rate) by 25 basis points (100 basis points equal one percentage point) to a range
of 3.50-3.75 per cent.
This is the third consecutive Fed rate cut since Sep2025. This calendar year, the Fed delivered a total rate cut of 75 basis points (see two charts below).
The
rate cut cycle began in Sep2024 and is expected to continue in to 2026. The next FOMC meeting is slated for 28Jan2026.
The past rate hike cycle lasted from Mar2022 till
Sep2024 -- a period of two years and a half.
Fed's QT or quantitative tightening started on 13Apr2022 and ended on 01Dec2025 (see Update 02Nov2025 with charts 141 to 143 below for more).
QE Lite
In a separate statement, the Fed said it would start buying every month US Treasury Bills, as part of its reserve management purchases (RMPs). The first monthly purchase, amounting to USD 40 billion, is starting on 12Dec2025.
The Fed further say the monthly purchases will taper off over a period of time. The amount of monthly purchases is flexible depending on the market conditions.
The market is describing the move by the Fed to purchase US Treasury Bills on a monthly basis as 'QE Lite.'
Chart 5: Fed Funds rate from Jul2024 to till now >
Chart 4: Calendar year-wise changes in Fed rate from 2003 to 2025 >
Charts 147 and 148 click on the image to view better >
--------------------------------------------------------------
Update 03Dec2025: Chart 146:
India current account deficit (CAD) : India CAD data: quarterly CAD data: India current account deficit (CAD) : For India Yearly / Quarterly CAD data, BoP data and others, see:
Update 21Sep2025 with Chart 124 - yearly CAD data
Update 09Jul2025 with Charts 112 and 113 - yearly BoP data for 11 years with definitions
Update 29Jun2025 with Chart 101 - yearly BoP data - 11 year BoP data with definitions
Update 28Jun2025 with Chart 99 - yearly CAD data
Update 03Sep2025 with Chart 121 - quarterly CAD data
Update 02Sep2025 with Chart 120 - quarterly BoP data
Update 30Jun2025 with Chart 102 and related blog - quarterly CAD data with 100 quarters CAD data
India's
current account deficit (CAD) for the Jul-Sep2025 quarter is 1.3 per
cent of GDP, declining from 2.2 per cent of GDP in corresponding quarter of
previous year, as per RBI press release of 01Dec2025.
While the year-on-year current account deficit (CAD) declined, it increased on a quarter-to-quarter basis. India’s CAD for the July–Sep2025 quarter rose to 1.3 per cent of GDP, up from CAD of 0.3 per cent in the previous quarter.
(Note Large Revision of quarterly CAD data: The current account deficit for Q2:2024-25 has been revised upwards from USD 16.8 billion or 1.8 per cent of GDP to USD 20.8 billion or 2.2 per cent of GDP due to downward revision of exports in Customs data. In Q1:2025-26, the current account deficit stood at USD 2.7 billion or 0.3 per cent of GDP).
In the Apr–Jun2025 quarter, India’s current account deficit stood at just 0.3 per cent of GDP, and the Jan–Mar2025 quarter even recorded a surplus of 1.3 per cent of GDP—figures that drew praise from the media and several prominent commentators for India’s effective control over the CAD.
However, when the deficit rose to 1.3 per cent of GDP in the Jul–Sep2025 quarter, the sharp increase from the previous quarter’s low went largely unacknowledged, with the same voices remaining notably silent.
Additionally, the media and several market veterans often overlook the structural trend of a persistently elevated current account deficit. Their reactions tend to be disproportionately positive when a quarter delivers a low reading, reflecting a focus on short-term fluctuations rather than the underlying long-term dynamics.
An examination of 100 quarters of India’s current account data in my previous analysis revealed an important pattern: current account surpluses have historically aligned with episodes of subdued or negative economic growth. This underscores a key structural reality—India requires a moderate current account deficit, ideally below 2 per cent of GDP, to support its growth trajectory.
India needs a CAD below 2 per cent because its investment-driven growth model requires steady but sustainable foreign capital (India is capital-hungry). A moderate deficit can be comfortably financed through stable inflows like FDI, remittances and services exports without creating external sector stress.
When CAD rises above this threshold, it puts pressure on the rupee, raises imported inflation and increases dependence on volatile capital flows. Historically, CAD episodes above 2 per cent have triggered currency instability, while surpluses have typically coincided with weak domestic demand. Thus, a CAD under 2 per cent strikes the balance India needs—strong growth with manageable external risk.
The current account (CA) balance fluctuates quarter to quarter, moving between deficit and occasional surplus.
The two recent surpluses were:
Jan-Mar 2025: +1.17 lakh crore rupees or USD 13.4 billion (1.3% of GDP)
Jan-Mar 2024: +0.38 lakh crore rupees or USD 4.6 billion (0.5% of GDP)
Fluctuating
but persistent deficit: Most quarters show a negative CAD, confirming
India’s tendency to run a current account deficit.
Intermittent surpluses: Surpluses are rare and brief, seen only in two quarters out of the 10 listed (see chart below).
Ten quarters data tell us about short-term volatility, but not much about macroeconomic fundamentals. If you want to analyse long term trends, use long-term CAD data integrating it with external sector fundamentals and other macro economic indicators.
You may be interested in reading a recent blog published on India's elusive current account surplus (data for 100 quarters is analysed).
Forex Reserves:
There was a depletion of USD 10.9 billion to the forex reserves (on a BoP basis) in Jul-Sep2025 quarter as against an accretion of USD 18.6 billion in Jul-Sep2024 quarter.
FDI Flows:
Quarterly data: Foreign direct investment (FDI) recorded a net FDI inflow of USD 2.9 billion in Jul-Sep2025 quarter as against a net FDI outflow of USD 2.8 billion in the corresponding period of 2024-25.
Half-yearly data: Net FDI inflows increased to USD 7.7 billion in first half of FY 2025-26 from USD 3.4 billion in first half of 2024-25.
FPI Flows:
Quarterly data: Foreign portfolio investment (FPI) recorded a net outflow of USD 5.7 billion in Jul-Sep2025 quarter as against a net inflow of USD 19.9 billion in Jul-Sep2024 quarter.
Half-yearly data: FPI recorded net outflows of USD 4.1 billion in first half of FY 2025-26 as against net inflows of USD 20.8 billion in first half of 2024-25.
India quarterly CAD
data (in Rs lakh crore) of CA deficit of CA surplus (as the case may
be) and CAD / CAS as a percentage of GDP: Date from Apr-Jun2023 to Jul-Sep2025 quarters:
Data sources:
RBI press release 01Dec2025: Developments in India's Balance of Payments RBI press release 01Dec2025: Sources and variation in forex reserves RBI DBIE Table 195: India overall BOP quarterly - RupeesRBI DBIE Table 194: India overall BOP quarterly - US Dollars
Chart 146 Click on the chart view better >
--------------------------------------------------------------
Update 26Nov2025: Charts 144 and 145:
US Dollar Sale and Purchase by Reserve Bank of India: (old blog dated 05Aug2021 with monthly and yearly data for several years)
Two
charts showing monthly and quarterly data of USD sales and purchases by
RBI > Data avilable only till 30Sep2025 as RBI releases official
data on currency intervention with a two month gap >
Between Jul2025 and Aug2025, RBI has been net seller in all three months,
with total net sale amounting to USD 18.1 billion. Net sales in the past six
months amount to USD 21.7 billion and for the past one year, net sales
were a staggering USD 64.8 billion.
Year-to-date, the US dollar
gained 4.19 per cent versus the Indian rupee -- conversely, INR lost 4.02 per cent vs the USD. Since the start of 2025, rupee has been
volatile. It even appreciated to a level of 84 during the first week of
May2025.
Even
though, US dollar index (DXY), a guage of USD versus six major
currencies, has fallen almost 10 per cent YTD, rupee has been under
pressure due to Trump tariffs and RBI currency intervention (or lack of
intervention) strategies.
As of yesterday (25Nov2025), rupee closed at 89.23, very close to its lowest in history versus the dollar.
Compared
to Oct-Dec2024 period net sales of USD 44.7 billion, RBI currency
intervention has been subdued in the period between Jan2025 and
Jun2025.
Currency intervention:
During Jul-Sep2025 period, RBI resorted to heavy defence of rupee by
resorting the USD combined sales of 18.1 billion. In the past four months, RBI has net sold every month with the net sale of USD by RBI amounting to USD 21.8 billion.
--------------------------------------------------------------
Update 02Nov2025: Charts 141 to 143:
US Federal Funds Rate Cycles Since 1999 to Now : (old blog dated 25Feb2023):
The three charts below show the following:
> US Fed's Quantitative Easing (QE) and Quantitative Tightening (QT)
> US Fed's Four Interest Rate Hike Cycles Since 1999
> US Federal Funds Rate Cycles Since 1999 to Now
The
current downward interest rate cycle in the US started in Sep2024 and
is continuing now; and it's expected to continue at least for another
six months, subject to incoming data. In the current down cycle,
the
US Fed has decreased the Fed funds rate by 150 basis points so far.
However, Trump's tariffs have complicated the Federal Reserve's efforts to steer US PCE inflation back toward its long-term 2 per cent target.
The
large-scale and sweeping reciprocal tariffs announced by the Trump
administration on 02Apr2025 are creating supply chain
disruption leading to higher consumer prices in the US jeopardising
Fed's efforts to tame inflation.
The US government shutdown (due to political bickering on Capitol Hill) has complicated matters for financial markets, with data not being released on time or delayed considerably.
The FOMC at its meeting on 29Oct2025 announced a further 25 basis points reduction in Fed funds rate, in line with market expectations. However, the Fed chair Jerome Powell's post-Fed meet press conference comments expressing doubt about another rate cut in December next seemed to have spooked global financial markets somewhat.
The
quantitative tightening (QT) cycle started in Apr2022 and is ending on 01Dec2025 as announced by the US Federal Reserve a few days ago. This is good news for markets.
When the Fed reduced its balance sheet size through QT, what it meant was it allowed some of the Treasury securities and mortgage-backed securities (MBS) it held to mature—but it did not reinvest the proceeds into new securities.
Normally, when a Treasury or MBS reaches maturity, the Fed would receive the principal amount back and then buy new securities to keep its balance sheet size steady. During QT, the Fed stopped buying replacements for these maturing securities, so the total amount of assets on its balance sheet gradually shrinks. In essence, the Fed reduced its balance sheet size through QT in a passive way in the past three years and a half.
QT Ending: From 01Dec2025 onwards, the Fed will cease allowing its security holdings to decline and will instead reinvest all proceeds from maturing assets into new government securities. This marks a shift from balance sheet reduction (“runoff”) to maintenance (“reinvestment”), ensuring that the level of central bank money and reserves in the banking system remains stable rather than continuing to fall.
With the Fed ending QT from 01Dec2025, its balance sheet size will no longer contract and is expected to stabilise, with the possibility of gradually increasing over time. This does not automatically mean start of QE by the Fed once again.
What Ending QT Means for Financial Markets Globally:
Increased Liquidity: With the Fed halting QT, more liquidity will stay in the financial system.
Lower Interest Rates: The improved liquidity backdrop may push market interest rates lower, especially supporting longer-duration US Treasuries.
Positive Signals for Risk Assets: Equities and credit markets (investment grade and high yield) could see renewed appetite as liquidity and lower rates support riskier assets.
Impact on Currency Markets: The US dollar could see downward pressure in the near term as liquidity improves. However, dollar strength may persist due to relatively higher US yields, stable economic conditions compared to other regions and global capital flows.
Emerging Markets: More available liquidity may support capital flows to emerging markets, including Indian equities, over the medium term - depending on other factors.
Fed Balance Sheet Contraction: Between Apr2022 and now, the US Fed's balance sheet size decreased from USD
8,965 billion to USD 6,587 billion, a decrease of more than USD 2,378 billion or 26.5 per cent decline.
However,
from the start of QE in Sep2008, the US Fed's balance sheet has grown
from USD 905 billion to USD 6,587 billion now -- an increase of 628 per
cent in 25 years.
Data sources:
Charts 141 to 143 click on the them to view better >

--------------------------------------------------------------
Update 30Oct2025: Chart 140:
US Federal Reserve Funds Rate: Fed Funds Rate (for old data see charts below and see here) >
The US Federal Open Market Committee (FOMC) at its meeting on 29Oct2025 reduced federal funds rate by 25 basis points to a range
of 3.75-4.00 per cent.
This is the second rate cut in 2025 (see chart below).
The
rate cut cycle began in Sep2024 and is expected to continue in to 2026. The next FOMC meeting is slated for 10Dec2025.
The past rate hike cycle lasted from Mar2022 till
Sep2024 -- a period of two years and a half.
Interestingly, Stephen I. Miran voted against the FOMC resolution (who preferred to lowering fed funds rate by 50 basis points). So is Jeffrey R. Schmid, who preferred no change to the fed funds rate at this meeting.
The Federal Open Market Committee (FOMC) decided to conclude the reduction of its aggregate securities holdings on 01Dec2025 -- meaning the Fed is ending the Quantitative Tightening (QT) or balance sheet reduction from that date.
QT started on 13Apr2022 (see Update 27Apr2025 with chart 73 below for more).
Fed Funds rate from Jul2023 to till now >
Chart 140 click on the image to view better >
--------------------------------------------------------------
Update 28Oct2025: Chart 139:
RBI Gold Holdings and Forex Reserves as at the end of Sep2025: RBI
gold reserves are part of India's forex reserves maintained by RBI on
behalf of Government of India (for more on RBI gold holdings, see blog dated 07Mar2022).
Gold
holdings of Reserve Bank of India increased from 879.6 metric tonnes in Mar2025 to 880.2 metric tonnes in Mar2025, an increase of just 0.6 metric tonnes in the past six months. The data are as per RBI's Half yearly report on management of foreign exchange reserves released today.
The
amount of gold holding (in US dollar terms) as a percentage of total
forex reserves of India is 13.9 per cent as of Sep2025 (11.70 per cent as of Mar2025); this is the
highest percentage of gold holdings in the past 16 years.
The value of RBI's gold holdings is USD 97.5 billion out of the total forex reserves of USD 700.1 billion as of Sep2025.
Gold repatriation from overseas vaults
During the period Apr–Sep2025, the Reserve Bank of India (RBI) repatriated around 58 metric tonnes, or one-sixth of the total, of physical gold that had been held abroad with the Bank of England and the Bank for International Settlements (BIS) to its vaults in India. This move increased the gold held domestically to 575.8 metric tonnes as of September 2025, while the gold held overseas declined to 290.4 metric tonnes.
Owing to a combination of fresh gold purchases and the repatriation of gold from foreign vaults, the share of the RBI’s physical gold holdings kept in India rose significantly—from a recent low of 37.8 percent in Sep2022 to 65.4 percent in Sep2025.
The decision to transfer gold back to India is seen as a strategic step by the RBI, undertaken in the context of Western nations such as the United States and European countries imposing economic sanctions on Russia and freezing its foreign exchange reserves following the Ukraine invasion in Mar2022.
RBI's forex reserves consist of:
foreign currency assets (FCA) -- 83% share in Sep2025
physical gold -- 13.9% share
SDRs -- small share
IMF Reserve -- small share
FCA earns returns for RBI, while other don't.
Rate of earnings for FY 2024-25 was 5.31% (See update 01Jun2025 with charts 80 to 82 for data).
RBI gold holdings comprise physical gold in India, physical gold overseas (with BoE and BIS) and gold deposits.
While the physical gold—both in India and overseas—does not generate any income, the gold deposits earn a modest return for the RBI.
Of the 880.2 metric tonnes gold, 14 tonnes is kept as gold deposits.
What are gold deposits?
RBI places a part of its physical gold holdings with foreign central banks or international financial institutions in order to generate returns. Such deposits are called gold deposits.
Gold deposits: RBI “lends” some of its gold reserves to a trusted international institution or another central bank. In exchange, RBI earns a small return for the deposits.
The Gold Deposit Rate (GDR) is very low; it's often paid in physical gold. The annual GDR is in 0.25-0.75% range.
Chart 139 click on the image to view better >
--------------------------------------------------------------
Update 19Oct2025: Chart 138:
FPI Equity Flows to India: India FPI Flows to Indian stock market, DII Flows to Indian stock market and Individual Investor flows to India stock market - both in rupee terms as well as dollar terms - calendar-year wise data from 2013 to 2025 > (old blog 10Jul2022) >
Calendar year 2025 data are upto 30Sep2025.
FPIs are foreign portfolio investors.
DIIs are domestic institutional investors.
Individual investors data for NSE secondary market only. Individuals include individual /proprietorship firms, HUF (Hindu Undivided Family) and NRIs (Non resident Indians).
Chart 138 click on the image to view better >
The above chart reveals:
In calendar year 2025 (up to 30th September), there is divergence between FPIs and DIIs. FPI flows (net) are minus Rs 1.55 lakh crore (minus USD 17.6 billion), while DII flows (net) are positive at Rs 5.79 lakh crore (+ USD 66.9 billion). Individual investor flows (net) are insignificant but positve at Rs 0.19 lakh crore (+ USD 2.2 billion).
Despite heavy foreign outflows in 2025 so far, the Indian stock market appears resilient due to strong DII buying, with individuals contributing modestly. Year to date, Nifty 50 returned +4.1 per cent, while BSE Midcap index delivered negative returns of 3.3 per cent.
FPI Trends: There are Net Outflows in 2022 and 2025:
2025: -Rs 1.55 lakh crore (-USD 17.6 billion)
2022: -Rs 1.21 lakh crore (-USD 16.5 billion)
Strongest FPI Inflows:
2020: Rs 1.70 lakh crore (USD 23.0 billion)
2023: Rs 1.71 lakh crore (USD 20.7 billion)
2013: Rs 1.13 lakh crore (USD 20.1 billion)
DII Trends: They have been consistently Positive Since 2015, except in 2020 (COVID-19 Pandemic outbreak year). Indian stock market has experienced strong DII inflows in 2025, 2024 and 2022.
DIIs are increasingly becoming dominant stabilising forces, likely due to higher retail investor participation, higher role of pension funds like EPFO (see Update 19Jun2025 with charts 51 to 55) and growing SIP (Systematic Investment Plan) flows and mutual fund participation.
Individual Investors trends:
Typically show net outflows in earlier years (2013–2019), turning positive from 2020 onwards. But their participation in 2025 and 2023 was lacklustre.
Retail investors became significant during and after COVID-19, possibly driven by: Easy digital access, lockdown-driven savings and rise of financial literacy and demat accounts.
The smaller figure of 2025 might reflect volatility, profit-booking or shift to other asset classes, like, precious metals (gold and silver).
Comparing FPI inflows of 2023 and 2013 in Rupee and Dollar terms:
Despite similar US dollar values (USD 20.7 billion in 2023 vs USD 20.1 billion in 2013), the rupee values are very different:
2023: +Rs 1.71 lakh crore
2013: +Rs 1.13 lakh crore
That’s nearly 50 per cent higher in rupee terms in 2023.
Why the Difference?
This is due to currency Depreciation — Indian rupee depreciated significantly from 2013 to 2023.
The US dollar-Indian rupee (USD INR) exchange rate as on 31Dec2013 was 61.80 and by the end of 2023 Indian rupee weakened against the dollar to 83.21.
Why This Matters:
For policymakers/regulators: Tracking flows in USD is useful to assess external vulnerability (capital flows in hard currency - see update 28Jun2025 with Chart 100 below for data).
For market liquidity/impact: Rupee values are more relevant — as stock market trades, valuations and investments happen in rupees.
This is a textbook example of currency effect on cross-border capital flow measurement.
One Caveat
In any stock market trade, one party buys and another sells. So, at the transactional level, it’s always a zero-sum exchange of securities. But in the chart above, the sum of all three groups do not add up to zero. Why?
For example, during 2025, the FPI flows are minus Rs 1.55 lakh crore, DII flows are +Rs 5.79 lakh crore and Individual investors +Rs 0.19 lakh crore; net total infows are Rs 4.43 lakh crore (not zero).
The data in the image show net investment flows for three categories of participants only:
FPIs, DIIs and Individual investors (Retail, HUFs, NRIs, etc.).
The market has many more participants than these three, like:
> Corporate / non-corporate promoter trades (promoter buying and promoter selling)
> Private equity / venture capital exits (PE exits)
> Proprietary trading desks (of brokers)
> Non-institutional trades
> Trades of Government sector / Government promoter entities
> Foreign direct investment (FDI) outflows
Net flows from other participants are not shown, and they can absorb or provide liquidity in ways that balance the overall market.
Other excluded groups from the above chart are:
Individual investors include only data from NSE India for secondary market only. So, primary market data (IPOs or initial public offers) from NSE are not included in the above chart. Data from BSE India too are excluded in the above chart.
Off-market deals too are not always captured.
The data from these excluded groups is not readily available, hence these are not reported frequently due to non-availability of aggregated data.
The Indian stock market is a multilayered ecosystem. The data in the above chart show only a slice — albeit an important one. Promoter net selling and PE exits explain much of the discrepancy in net inflows not summing to zero.The promoter / PE exit activities have increased significantly in recent years, especially as markets hit all-time highs and exits became more attractive.
You may check the blog "NSE Ownership Trends in NSE-listed Universe of Stocks" to know about different kind of investors / entities that own the stock market in India.
--------------------------------------------------------------
Update 12Oct2025: Chart 137:
MSCI EM Index - China and India weights: Quarterly changes between Sep2025 and Jun2025: (for old data, see old blogs dated 07Jan2023 and blog 03Aug2021 and previous charts below)
India's position in the MSCI EM Index continues to be in third rank, as India has been underperforming grossly since the beginning of 2025. China and Taiwan continue to dominate the index as of Sep2025.
India has slipped from second in Mar2025 to third rank in Sep2025. Taiwan
regained second rank in Jun2025. There is a see-saw battle between India
and Taiwan for second rank in the past six quarters.
Taiwan's TSMC, with a weight of 10.87 per cent, is at the top as at the end of Sep2025.
It is noteworthy only top five countries account for 80
per cent of the weight in MSCI EM index.
The
chart below looks at the past five quarters data, with valuation
ratios, top five countries and top five companies.
Only two Indian companies are in the top ten of the list.
Changes in the past one year:
China's weight increased from 27.8 to 31.2 per cent between Sep2024 and Sep2025 while that of India decreased from 19.5 to 15.2 per cent (India
suffered heavy selling between Oct2024 and Mar2025). In the same period,
weights of Taiwan and South Korea have gone up.
For
almost five years, Taiwan's TSMC maintains its rank as the number one
company with highest weight in MSCI EM index. TSMC alone accounts for
more than 50 per cent weight for Taiwan.
EM outperformance YTD in 2025: For the first time in five years, MSCI EM index is outperforming MSCI World index year to date, with return of 25.2 per cent versus 16.2 per cent for MSCI World.
In the past 14 years (2011 to 2024), MSCI World massively outperformed MSCI EM in 10 years, while MSCI EM dominated with outperformance in only four years (2020, 2017, 2016 and 2012).
Chart 137 click on the image to view better >
--------------------------------------------------------------
Update 12Oct2025: Chart 136:
US Federal Reserve Funds Rate: Fed Funds Rate (for old data see charts below and see here) >
The US Federal Open Market Committee (FOMC) at its meeting on 17Sep2025 reduced federal funds rate by 25 basis points to a range
of 4.00-4.25 per cent.
This is the first rate cut since Dec2024 (see chart below).
The
rate cut cycle began in Sep2024 and is expected to continue in to 2026. The next FOMC meeting is slated for 29Oct2025.
The past rate hike cycle lasted from Mar2022 till
Sep2024 -- a period of two years and a half.
Fed Funds rate from Jul2023 to till now >
Chart 136 click on the image to view better >
--------------------------------------------------------------
Update 12Oct2025: Charts 132 and 135:
FPI AUC data: FPI / FII AUC data: Assets under custody (AUC) data of foreign portfolio investors (FPIs): the four charts below are:
FPI equity assets - Quarterly data (past 11 quarters)
FPI equity assets - Yearly data (past 9 years)
FPI debt assets - Quarterly data (past 11 quarters)
FPI debt assets - Yearly data (past 9 years)
(for old data > Old blog dated 10Jul2022 - Exit India Policy by Foreign Investors; and old blog dated 28Apr2022 - Foreigners' Shrinking Pie in Indian Equities)
FPI
equity assets, as on 30Sep2025, are Rs 70.7 lakh crore, as compared to Rs 74.2 lakh crore on 30Jun2025.
FPI equity assets are USD 796.5 billion as on 30Sep2025, showing a decline of 14.3 per cent compared to a year ago. In
the same period, Nifty 50 dropped by 4.6 per cent.
FPI equity assets (in dollars terms) declined faster than the decline in Nifty 50 indicating FPI outflows in the Oct2024-Sep2025 period.
In the past one year (Oct2024-Sep2025), FPI equity outflows are Rs 2.55 lakh crore (see Update 07Oct2025 with charts 127 to 131 below).
A combination of heavy FPI outflows and Nifty 50 decline resulted in share of FPI equity assets (FPI equity AUC) falling from 16.4 per cent (as a percentage of total market cap of
all BSE listed firms) in Sep2024 to 15.7 per cent in Sep2025.
FPI investors have been losing interest considerably in Indian stocks in the past four years -- their share has come down
from almost 20 per cent in Mar2021 to below 16 per cent now; domestic
investors' share has been rising gradually during the period.
In the charts below for equity AUC, you could find data relating to equity AUC in rupees and dollars, year-on-year percentage change in equity AUC in dollar terms, Nifty 50 level, year-on-year percentage changes in Nifty 50 and the US dollar - Indian rupee exchange rate.
FPI debt assets, as on 30Sep2025, are Rs 7.0 lakh crore, as compared to Rs 6.6 lakh crore on 30Jun2025.
FPI debt assets are USD 78.6 billion as on 30Sep2025, showing an increase of just 2.3 per cent compared to a year ago. As can be seen in the chart attached below, the growth rates of debt assets have fallen during 2025, though total assets are growing.
Debt assets at USD 78.6 billion are nearly one-tenth of equity assets (USD 796.5 billion) as of 30Sep2025.
Bond inclusion: After the inclusion of Indian sovereign bonds in emerging market bond indices like, JP Morgan and Bloomberg, FPI debt assets (debt AUC) have grown from USD 52.7 billion in Sep2023 to USD 78.6 billion in Sep2025.
To a mild extent, the huge outflows of FPIs in equity segment have been compensated by inflows into debt segment.
In the charts for debt assets, you could find data relating to debt AUC in rupees and dollars, year-on-year percentage change in debt AUC in dollar terms, 10-year G-Sec yield and the US dollar - Indian rupee exchange rate.
Total
assets (including equity and debt) in India held by forign portfolio investors (FPIs) as on 30Sep2025 are USD 875 billion as compared to USD 1 trillion achieved as of 30Sep2024.
Charts 132 to 135 click on them to view better >
--------------------------------------------------------------
Update 07Oct2025: Charts 127 to 131:
FPI Equity Flows to India: Foreign Portfolio flows: 15-month FPI flows to India in the equity segment (old blog 10Jul2022) > 15-quarter flows also >
FPI Debt Flows to India: Foreign Portfolio flows: 15-month FPI flows to India in the debt segment > 15-quarter flows also >
FPI Equity Flows: The data include Sensex and BSE 200 levels as at the end of the respective quarter / month -- which will enable the readers to discern the impact of FPI outflows / inflows on the Indian stock market.
Past 5 year FPI Equity Flows: It includes past five year equity flows for each quarter, totalling 20 quarters.
During Apr-Jun2025 quarter, FPI equity flows were positive at Rs 38,673 crore; but they turned negative in Jul-Sep2005 quarter with outflows of Rs 76,619 crore (significantly, all the three months in the quarter experienced negative outflows).
In the quarter, Sensex lost 4 per cent of its value, while BSE 200 index ended with negative return of 3.6 per cent -- this is as per data from NSDL.
As shown in the chart below, the total FPI equity inflows in the past five years were just Rs 63,242 crore, which is piffling considering the size of the Indian economy and the opportunity it offers for global investors.
As on 30Sep2025: Rs crore
Past one year FPI equity flows -2,54,703
Past two year FPI equity flows -1,03,505
Past three year FPI equity flows 64,364
Past five year FPI equity flows 63,242
As the total share of FPIs in Indian stock market has been declining steadily over the years, their influence on market has markedly come down. However, the dramatic outflow of Rs 2.55 lakh crore in the past one year has indeed negatively impacted Indian stocks.
Indian stocks are one of the worst performing globally while the stock indices in the US, Japan, Australia, Taiwan, Africa and Europe have been scaling all time highs (ATH).
FPI Debt Flows: The following charts include monthly and quarterly data of FPI or foreign portfolio investor flows into the Indian debt market. The data for debt include VRR, FAR, hybrid, MF, etc.
The charts also include month- and quarter-end levels of India benchmark 10-year G-Sec yield, so that readers can discern the impact of debt flows on the Indian debt / G-Sec market. One saving grace for India is steady and increasing FPI debt flows, especially since Sep2023. The inclusion of Indian bonds in the emerging market indices of Bloomberg and JP Morgan has led to robust debt flows -- total inflows since the inclusion (between Oct2023 and Sep2025) are Rs 2.57 lakh crore.
In the given charts below, you could check monthly as well as quarterly debt flows by FPIs.
Five charts showing FPI Equity and FPI Debt flows >
past 15-month as well as past 15-quarter data >
Click on the charts to view better >
--------------------------------------------------------------
Update 01Oct2025: Charts 125 and 126:
Global market data: Global market data pertaining to stocks, bonds,
commodities and currencies are presented here (old blog dated 29Jun2024).
Quarter-to-date
(QTD) global market data, as on 30th of September, 2025, of stocks, bonds,
currencies and commodities is as follows:
During Jul-Sep2025 quarter (QTD), Shanghai Composite is the biggest winner with 12.7 per cent return, followed by Hang Seng with 11.6 per cent return.
Sensex and Nifty 50 lost 4.0 and 4.6 per cent respectively during the quarter -- continuing their underperformance of previous two quarters.
The year-to-date (YTD) chart is also attached below.
QTD >
--------------------------------------------------------------
Update 21Sep2025: Chart 124:
India current account deficit (CAD) : India yearly CAD data: For quarterly CAD data, BoP data and others, see:
Update 03Sep2025 with Chart 121 - quarterly CAD dataUpdate 02Sep2025 with Chart 120 - quarterly BoP data
Update 09Jul2025 with Charts 112 and 113 - Yearly BoP data for 11 years with definitions
Update 30Jun2025 with Chart 102 and related blog - quarterly CAD data with 100 quarters CAD data Update 29Jun2025 with Chart 101 - yearly BoP data - 11 year BoP data with definitions
and Update 28Jun2025 with Chart 99 - yearly CAD data
India is a powerhouse of software services exports. This is an analysis of the trends in 'software services' exports in the past six years.
Software services exports are part of total services exports. They are a major chunk of India's services exports.
As per IMF BPM6 format (more on this below), services exports are classified as:
> Manufacturing services on physical inputs owned by others
> Maintenance and repair services n.i.e.
> Transport
> Travel
> Construction
> Insurance and pension services
> Financial services
> Charges for the use of intellectual property n.i.e.
> Telecommunications, computer and information services
> Other business services
> Personal, cultural, and recreational services
> Government goods and services n.i.e.
> Others not included elsewhere (n.i.e.)
India Software Services Exports:
Software services primarily fall under the category "Telecommunications, computer and information services," which specifically includes activities directly related to software development, system and application programming, management consulting and IT-enabled services.
However, some aspects of software-related activities—such as software-related research and development (R&D), technical consulting and other specialized professional services—may also be captured under "other business services."
This "other business services" category includes broader knowledge-based and technical services that support business processes, research and development (R&D), legal services, accounting and auditing services, advertising, marketing research, innovation and technology implementation -- which can overlap with parts of the software services ecosystem.
Thus, there is a relation between software services and "other business services" as defined in the IMF BPM6 framework.
Core software services like programming, IT operations, and software provision are classified under telecommunications, computer and information services.
Ancillary software-related expert services like R&D, technical consulting and management consulting may fall within "other business services."
In practice, there is a significant overlap (a software consulting firm might provide both strategic advice and hands-on coding) between software services and other business services.
Thus, "other business services" can complement and overlap with software services in areas like R&D and professional/technical consulting that support software and IT functions.
Notes on IMF BPM6 format: The International Monetary Fund (IMF) encourages countries to report the Balance of Payments (BoP) and International Investment Position (IIP) as per BPM6 format.
This is an international standard for compiling BoP data.
Even RBI started reporting the BoP data in BPM6 format.
IMF introduced the BPM6 format in 2008 / 2009.
The new BPM6 format updated the earlier BoP CG (compilation guide) of 1995.
Data analysis of the graph below:
Software services and IT-related exports are the largest contributors to India’s services export growth.
India's total services exports grew from USD 213.2 billion in FY 2019-20 to USD 387.5 billion in FY 2024-25 -- shwoing an absolute growth of more than 80 per cent in five years, which is quite phenomenal.
Software services exports: As explained above, let us combine two categories (part of total services exports), namely, telecommunications, computer and information services and other business services as softwaare services for the sake of simplicity.
Total software services grew from USD 141.8 billion in FY 2019-20 to USD 290.6 billion -- their growth more than doubled in the past five years.
In India's total services exports, the top two services combined as software services have a huge share. Software services share increased from 36.6 per cent in 2019-20 to a staggering 75 per cent in 2024-25.
(Even if some part of the "other business services" category are not considered strictly as software services, we can safely assume the share of software services is around 70 per cent of India's total services exports).
It is remarkable that India is heavily dependent on software services exports. The share of other parts of total services, like, travel, financial services, construction, insurance and others has not shown any notable increase in the past six years.
However, in case of Transport services, the share grew from 5.4 per cent in 2019-20 to 8.7 per cent in 2024-25.
Growth rates of top two items in India's services exports:
1. telecommunications, computer and information services: (data as of 2024-25):
1-year growth: 12.1%
3-year CAGR: 13.4%
5-year CAGR: 13.8%
2. Other business services: (data as of 2024-25):
1-year growth: 21.0%
3-year CAGR: 22.1%
5-year CAGR: 18.6%
As can be seen from above, item 1 above is showing steady growth in the past five to six years.
However, "other business services" have been growing at a faster clip compared to item 1 above in the past five years, though their share in overall services exports is much smaller compared to item 1 (27.7% versus 47.3% -- date for the lastest financial year).
The overall trend indicates that India's software services industry will remain a key player in global trade for the foreseeable future, continuing to drive the country’s services export growth.
Data sources:
Chart showing Break-up of India Services Exports / Software Services for the past six years (the data points in this chart align with data in Update 09Jul2025 with Charts 112 and 113)
Chart 124 Click on the chart view better >
--------------------------------------------------------------
Update 08Sep2025:
India FDI flows and FPI flows:
(see Update 02Sep2025 with chart 120 below)
(see Update 16Jun2025 with charts 91 and 92 below)
(Update 15Jun2025 with Charts 86 and 87)
(Update 15Jun2025 with Chart 85)
(Update 13Apr2025 with Chart 72)
(Update 13Apr2025 with Charts 69 to 71)
Sluggish FDI flows and FPI flows to India:
India official GDP growth rates have been impressive since 2022, though growth was sluggish in the middle of last year. But, India's high economic growth rates (See Update 29Aug2025 with Chart 70 and Update 30Jun2025 and Chart 56 of Indian Economy Data Bank) have not been traslating into high foreign capital flows.
The Achilles' heel of India has been the disastrous show in FDI in the past four years or so.
Another sour point in foreign capital flows is the lacklustre attitude of foreign portfolio investors (FPI flows or the so-called hot money) towards Indian stocks.
FPI debt flows, however, have been somewhat better in the past two years, especially after inclusion of Indian bonds in global indices, like, JP Morgan and Bloomberg.
During the Apr-Jun2025 quarter too, FDI flows were lukewarm at USD 7.3 billion, clocking a mere year-on-year growth of 2.8 per cent.
During the Apr-Jun2025 quarter, net capital flows to India have fallen by more than 50 per cent to USD 6.9 billion versus USD 13.9 billion in the corresponding quarter last year.
This
divergence between high economic growth and high FDI and FPI outflows
has raised questions about the deeper structural and policy issues at
play.
Underlying Factors Behind Weak FDI Flows and FPI Flows to India:
One major reason is policy uncertainty and regulatory overhang. While India has made progress on infrastructure development, foreign investors continue to cite unpredictable policy shifts, retrospective tax issues and sector-specific regulatory hurdles as deterrents.
High-profile tax disputes and sudden rule changes—particularly in sectors like digital services, telecom, and e-commerce—have added to the perception of risk.
Global macroeconomic conditions have also played a role. The past few years have seen significant global risk aversion due to rising US interest rates, inflation, geopolitical instability, prolonged Russia-Ukraine war and supply chain disruptions.
The strong dollar (at least till Feb2025) and higher US bond yields made Indian assets less attractive to global investors looking for safer returns.
Foreign companies continue to report delays in land acquisition (at the state level), complex labour laws, environmental clearances and legal disputes—factors that contribute to the perceived execution risk of investing in India.
Rising scrutiny over data protection, localisation and foreign ownership rules have created friction, particularly for companies from countries like China. India’s decision to screen FDI from neighboring countries has significantly curtailed Chinese investment, which was once a major contributor to start-up funding and tech-sector growth.
India’s capital account still operates under partial convertibility, with numerous restrictions and caps on foreign investment in certain sectors. While liberalisation efforts are ongoing, they have not kept pace with investor expectations.
In contrast, countries like Vietnam, Indonesia, Brazil and Mexico have moved more aggressively to capture global capital shifting away from China, offering clearer regulations, tax incentives and better logistics ecosystems.
According to a recent Reuters report, Mexico and Brazil in Latin American are benefiting hugely from foreign investments in recent years.
Foreign portfolio investors have shown limited enthusiasm for Indian stocks, despite strong earnings and economic growth. Several factors are at play here: higher valuations of Indian equities compared to regional peers, increased market volatility and concerns around taxation.
The reintroduction of long-term capital gains tax on equities in 2018, last year's rise in capital gains rates and other taxation issues have made Indian markets less attractive to portfolio investors.
Private equity and venture capital investors who entered the Indian market prior to 2021 are now exiting their positions through initial public offers or IPOs and secondary market sales, capitalising on the high valuations witnessed in early 2024.
Given the typical incubation period of five to seven years for VC/PE investments, this wave of exits could be more a function of investment cycles than a sudden shift in sentiment.
A silver lining: The fact that private equity and venture capital firms have been able to exit their investments smoothly -- mainly through primary and secondary market sales -- is actually a strong endorsement of the depth, efficiency and investor participation in Indian capital markets.
According to an EY report, total PE/VC exits in the past decade (since 2015) amount to USD 203.7 billion across 2,456 deals.
However, PE/VC exits surged during the last five years (since 2021) recording 68 per cent of the exits worth USD 139 billion across 1,395 deals.
PE / VC exits from India in USD billion:
9.2 in Jul2025 month
22.2 in 2025 (first 7 months)
28.1 in 2024
24.9 in 2023
18.3 in 2022
39.6 in 2021
6.0 in 2020
Not every emerging economy offers this kind of exit flexibility, especially at scale. In fact, for many global investors, the ability to eventually exit investments is just as important as the initial entry point.
While India's official macroeconomic performance has remained strong, corporate earnings growth has been relatively tepid over the past three to four quarters -- a key metric that FPIs closely track. The underperformance in earnings may have driven them away from Indian stocks in recent quarters.
Adding to the headwinds is India’s inability to finalise a trade deal with the US over the past five months. The delay has cast a shadow over foreign investor sentiment.
For many, a comprehensive trade agreement would serve as a strong signal of India’s openness and policy stability -- two factors crucial for sustained foreign investment.
To sum up, India’s weak foreign capital flows in the face of high GDP growth stem from a combination of domestic policy and regulatory challenges, global macroeconomic pressures, bureaucratic inefficiencies, sector-specific restrictions and intense competition from other emerging markets.
While there is optimism around India’s long-term potential, the country must address these concerns more decisively to unlock sustained foreign investment.
Most of Indian investors put two-thirds of their money in real estate and gold, leaving no room for capital market investmetns. As such, India is hungry for foreign capital.
Without deep structural and administrative reforms, high GDP growth alone may not be enough to attract the volume and quality of foreign capital India needs.
(Complement the above analysis with Tweet 16Jun2025 -- Update 16Jun2025 with charts 91 and 92)
--------------------------------------------------------------
Update 03Sep2025: Charts 122 and 123:
Share of Major Currencies in Official Forex Reserves: Currency Share of Central Banks Forex Reserves
World total forex reserves of central banks
(old blog dated 04Nov2023 Is De-Dollarization Real?) >
Clarification: The global IMF / COFER (Currency composition of official foreign exchange reserves) data include only currency reserves, but do not inlcude gold reserves of central banks around the world.
COFER data of world total forex reserves: As of Mar2025, the world's total forex reserves of central banks are USD 12.54 trillion, according to COFER data. The reserves increased by nearly 13 per cent since 2015 (see chart below).
The peak reserves, in the past 10 years, were USD 12.93 trillion as at the end of Dec2021. The reserves have declined 3 per cent between Dec2021 and Mar2025.
The decline in forex reserves from the Dec 2021 peak of USD 12.93 trillion reflects:
> A stronger US dollar reducing the dollar value of non-USD reserves (the US dollar index DXY rose from 95.7 in Dec2021 to 104.1 in Mar2025, a growth of 8.8 per cent; as of Dec2021, 41.2 per cent of reserves are held in non-US dollar assets -- this mainly explains the decline in world's forex reserves between Dec2021 and Mar2025),
> Active use of reserves to stabilize currencies amid volatility,
> A shift in reserve management by opting for diversification into gold, which is considered a safe-have asset,
> Emerging markets' gradually shifting from dollar assets, after the US weaponized dollar against Russia (post its invasion of Ukraine) and West's confiscation of Russia's forex reserves
> Active buying of gold in recent years by central banks from India, China, Poland, Turkey and Kazakhstan, and
> Broader macroeconomic headwinds, including rising interest rates, inflation and weakening global trade (weak trade leads to lower current account surpluses, account for slower accumulation of forex reserves).
COFER data of Currency Share of Central Banks Forex Reserves:
The data on the share of major currencies in official foreign exchange reserves, as reported by the International Monetary Fund (IMF) through its COFER database, shows several important trends between Dec2016 and Mar2025.
Over this period, the US dollar has remained the dominant global reserve currency, although its share has been gradually declining. In Dec2016, the US dollar accounted for 65.4 per cent of global forex reserves, but by Mar2025, this figure had fallen to 57.7 per cent.
This steady decrease over the years suggests a slow diversification away from the dollar, even though it still commands a clear majority of global reserves.
The euro, as the second-most widely held reserve currency, has maintained a relatively stable share throughout this time. From 19.1 per cent in Dec016, its share peaked slightly above 21 per cent in 2020 before settling at 20.1 per cent by Mar2025.
The Japanese yen has experienced mild fluctuations. Despite Japan's long-standing role in the global economy, the yen has not gained much additional ground as a reserve currency in recent years.
The pound sterling has seen relatively stable usage in global reserves. This consistency suggests continued confidence in the UK's financial system, even amid broader geopolitical and economic shifts such as Brexit.
The Chinese yuan entered the COFER data only in Dec2016, with a starting share of 1.1 per cent. Since then, it initially gained ground, reaching a peak of 2.8 per cent in Dec2021. However, its share has since declined to 2.1 per cent by Mar2025.
This downward trend may reflect uncertainties related to China’s financial system, regulatory policies or geopolitical concerns. Despite being the currency of the world’s second-largest economy, the yuan has not yet established a strong foothold in global reserves and its recent decline suggests challenges in gaining further acceptance.
As of now (2025), the currencies individually identified in COFER include:
US Dollar (USD)
Euro (EUR)
Japanese Yen (JPY)
British Pound (GBP)
Chinese Renminbi (CNY) – added in Dec2016
Canadian Dollar (CAD)
Australian Dollar (AUD)
Swiss Franc (CHF)
These are considered “designated reserve currencies” by the IMF.
The Indian rupee (INR) is not part of this group, which means:
> it is either not held in significant amounts globally as part of official reserves, or
> it is held, but not by enough countries or in large enough volumes for the IMF to report it separately.
Possible reasons why the Indian rupee is not a reserve currency?
Limited international use — The rupee is not yet widely used for global trade, investment or as a store of value by foreign central banks.
Capital controls — India maintains some controls on cross-border capital flows, limiting capital account convertibility (some controls exist even for current account convertibility) of the INR.
India's central bank, RBI, resorts to heavy forex intervention in forex markets in order to, what it calls as, "control excessive volatility." RBI follows a 'managed float' approach with exchange rate.
Volatility and liquidity concerns — The rupee is not as deep or stable as major reserve currencies.
Reserve preference — Most central banks prefer highly liquid, low-risk, freely convertible currencies.
That said, India is pushing to internationalize the rupee, including:
> Encouraging bilateral trade in INR (for example, with Russia and Iran),
> Allowing INR-based Vostro accounts, and
> Promoting currency swap lines with neighbors.
But it will likely take years for the INR to gain sufficient traction to become a recognized reserve currency and earn a spot in COFER data.
Overall, the data indicate a slow and cautious diversification by central banks, with limited but meaningful shifts in the composition of reserves over time.
data sources:
--------------------------------------------------------------
Update 03Sep2025: Chart 121:
India current account deficit (CAD) : India CAD data: quarterly CAD data: For Yearly CAD data and others, see:
Update 02Sep2025 / Chart 120; Update 09Jul2025 / Charts 112 and 113; Update 30Jun2025 / Chart 102 and related blog; Update 29Jun2025 / Chart 101; and Update 28Jun2025 / Chart 99.
India's current account deficit (CAD) for the Apr-Jun2025 quarter is 0.2 per cent of GDP, as compard to 0.9 per cent in corresponding quarter of previous year.
The current account (CA) balance fluctuates quarter to quarter, moving between deficit and occasional surplus.
The two recent surpluses were:
Jan-Mar 2024: +0.38 lakh crore rupees (0.5% of GDP)
Jan-Mar 2025: +1.17 lakh crore rupees (1.3% of GDP)
Fluctuating but persistent deficit: Most quarters show a negative CAD, confirming India’s tendency to run a current account deficit.
Intermittent surpluses: Surpluses are rare and brief, seen only in two quarters out of the nine listed.
Nine quarters data tell us about short-term volatility, but not much about macroeconomic fundamentals.
If you're analyzing India’s external sector from a policy or investment perspective, you’d want to:
1) Use long-term CAD data
2) Integrate it with structural factors (trade, remittances, capital flows)
3) Compare with other macro indicators (growth, inflation, exchange rate)
You may be interested in reading a recent blog published on India's elusive current account surplus (data for 100 quarters is analysed).
India quarterly CAD data (in Rs lakh crore) of CA deficit of CA surplus (as the case may be) and CAD / CAS as a percentage of GDP: Date from Apr-Jun2023 to Apr-Jun2025 quarters:
Chart 121 Click on the chart view better >
--------------------------------------------------------------
Update 02Sep2025: Chart 120:
India Balance of Payments (BoP): Quarterly BoP data: For more on this, see updates and charts as below:
Update 09Jul2025: Charts 112 and 113: India Balance of Payments (BoP): Yearly BoP data for 11 years with definitions
Update 30Jun2025: Chart 102: India Balance of Payments (BoP): India current account surplus versus current account deficit: India CAD data and Blog The Elusive Current Account Surplus: What 25 Years of Data Reveal About India's Trade Balance: - quarterly CAD data with 100 quarters CAD data
Update 29Jun2025: Chart 101: India Balance of Payments (BoP): yearly BoP data - 11 year BoP data with definitions
Update 28Jun2025: Chart 100: India External Debt Indicators:
Update 28Jun2025: Chart 99: India CAD: yearly CAD data with 16 years data
As per latest information released by RBI, India's current account deficit ( CAD) is USD 2.4 billion (0.2 per cent of GDP) during Apr-Jun2025 quarter, as compared to CAD of USD 8.7 billion (0.9 per cent of GDP) in Apr-Jun2024 quarter.
Key findings from comparison of first quarter of FY 2025-26 versus first quarter of FY 2024-25 data:
> Goods exports growth in the first quarter of FY 2025-26 is tepid with a year-on-year (yoy) growth of just 1.7 per cent, imports growth is 3.8 per cent
> Goods trade deficit in the first quarter of FY 2025-26 increased to USD 68.5 billion (yoy growth of 7.4 per cent)
> Services export growth in the first quarter of FY 2025-26 is 10.1 per cent, whereas services imports growth is just 1.4 per cent yoy
> NRI remittances (net transfers) grew in the first quarter of FY 2025-26 by 17.9 per cent yoy to USD 31 billion
> Overall, net invisibles clocked a yoy growth of 20 per cent in the first quarter of FY 2025-26 to USD 66.1 billion
> Net capital flows (capital account A to F in the chart below) are down by more than 50 per cent to USD 6.9 billion
> Net capital flows (capital account A to F in the chart below) are:
Foreign direct investment
Foreign portfolio investment (Equity plus debt)
External assistance, net
External commercial borrowings
NRI deposits, net
Others
> Foreign direct investment (FDI) in the first quarter of FY 2025-26 declined by 2.8 per cent (FDI flows USD 5.7 billion)
> FDI flows continue to be disastrous in the past four years or so (see Update 16Jun2025 with charts 91 and 92 below)
> External commercial borrowings (ECBs) in the first quarter of FY 2025-26 increased by three times to USD 4.5 billion as compared to the first quarter of 2024-25
> NRI deposits declined by 10 per cent to USD 3.6 billion
data sources:
RBI press release 01Sep2025: Developments in India's Balance of Payments RBI press release 01Sep2025: Sources and variation in forex reserves RBI HBIE PDF: Table 194: India overall BoP Quarterly - US dollar
chart 120 click on the image to view better >
--------------------------------------------------------------
Update 02Sep2025: Charts 117 to 119:
Major Foreign Holders of US Treasury Securities:
Top 20 Countries Holding US Treasuries:
How Countries' Ranks Changed Over the Past Year:
India's Holdings of US Treasury Securities:
Diversification Strategy of RBI Forex Reserves:
According to the data published by the US Treasury, the total holdings of US Treasury Securities held by all foreign residents are USD 9,128 billion as at the end of Jun2025.
There is an increase of USD 828 billion or 10 per cent, of US Treasury holdings by foreign entities, versus a year ago (end-Jun2024). See tables below.
Japan continues to be the higgest holder of US treasuries with holdings of USD 1,148 billion, followed by the UK (858), China (756), Cayman Islands (443) and Canada (439). The share of these top five countries in total holdings are 12.6, 9.4, 8.3, 4.9 and 4.8 per cent respectively as on Jun2025.
Countries slipped in ranking between Jun2024 and Jun2025:
China
Luxembourg
Ireland
India
Brazil
Germany
For
example, China as of Jun2024 used to hold second rank and it now
slipped to third as of Jun2025. Luxembourg's rank slipped from 4th to
7th. India's rank is down to 14th from 12th.
Countries surged in ranking between Jun2024 and Jun2025:
United Kingdom
Cayman Islands
Belgium
France
Singapore
Hong Kong
Israel
For example, the UK is now ranked 2nd compared to 3rd a year ago. Singapore's ranking increased to 12th from 15th.
US Treasury Securities held by Foreign Residents:
As of Jun2025, the US Treasury Securities held by Foreign Residents are USD 9,128 billion. Of these, USD 3,920 billion are held by Foreign Official sources and the remaining USD 5,208 billion are held by foreign private entities.
Foreign Official Holdings: This includes the holdings of foreign governments, central banks (like the BoE, BoJ, PBOC, RBI) and other official institutions (like sovereign wealth funds).
Foreign Private Holdings: This includes all other foreign investors. This is a very diverse group and includes:
Foreign commercial banks,
Foreign corporations,
Foreign pension funds and insurance companies,
Individual foreign investors, and
Other private entities and investment funds.
India holdings of US Treasury Securities: As of Jun2025, India's holdings are USD 227 billion, compared to USD 242 billion as of Jun2024. Of the total foreign holdings of US Treasuries of USD 9,128 billion, India's share is 2.5 per cent now compared to 2.9 per cent a year ago.
It may be noted India's central bank, RBI, holds offficial forex reserves on behalf of Government of India.
It's better to avoid reading too much into this data; Indian media are sensationalising this data, saying RBI's holdings of US Treasury securities have come down.
Past one year data on US Treasury holdings by India have been volatile.
In the past 31 months, the lowest UST holdings by India are USD 219 billion as of Dec2024.
We don't know what the RBI holdings in sovereign bonds of other countries are. For example, does RBI hold any sovereign bonds from the UK, France, China, Brazil, Japan, South Africa or Nigeria for that matter?
One needs to analyse the data dispassionately. It seems Indian media come to the conclusion first and then present the data to suit their conclusions, without considering the long term data or other connected areas.
Growth rates in Indian Holdings of total US Treasury securities as of 30Jun2025:
1) Past 1 quarter (Mar–Jun 2025) -5.20%
Recent decline (from USD 239.9 bn to USD 227.4 bn)
2) Past 2 quarters (Dec 2024–Jun 2025) 3.80%
Net increase despite recent drop
3) Past 1 year (Jun 2024–Jun 2025) -6.00%
Moderate YoY decline
4) Past 3 years (Jun 2022–Jun 2025) 8.90%
Decent medium-term growth
5) Past 5 years (Jun 2020–Jun 2025) 24.40%
Strong long-term growth (from USD 182.7 bn to USD 227.4 bn)
A 5.2 per cent decline in a single quarter is noteworthy, but not alarming.
The 6 per cent decline YoY (Jun 2024 → Jun 2025) is mild, especially in the context of:
A USD 18.6 billion increase over 3 years.
A USD 44.6 billion increase over 5 years.
Media focus on recent quarters might exaggerate concern by not acknowledging the strong upward trend since 2020.
Diversification strategy of forex reserves by RBI:
Of course, the Reserve Bank of India (RBI) has been diversifying its forex reserves in recent years. This is more pronounced since the outbreak of Russia-Ukraine war in Feb2022. But since the outbreak of Russia-Ukraine war, RBI holdings of US Treasury Securities has increased by 13.8 per cent (between Mar2022 and Jun2025).
The value of RBI gold holdings (due to a combination of sharp rise in dollar gold price internationally and new physical gold bought by RBI) has increased over the years and the share of gold reserves in total forex reserves too has risen (see Update 05May2025 below with charts 74 to 76 for RBI gold holdings).
Significantly, RBI has not practically bought any physical gold between Mar2025 and Jun2025. Its gold holdings remained stagnant at 880 metric tonnes in the current financial year.
However, the market value of its gold holdings increased from USD 78.2 billion in Mar2025 to USD 84.5 billion by Jun2025, as the gold has been reaching all time highs recently (RBI Bulletin 28Aug2025 data).
US Treasuries (UST) share in RBI Forex Reserves fell to 32.4 per cent in Jun2025 vs 35.9 per cent in Mar2025, whereas gold holding share rose to 12 per cent vs 11.7 per cent in the same period.
From Mar2022 to Jun2025, UST holdings rose from USD 199.8 billion to 227.4 billion, while the their share in total forex reserves declined slightly from 32.9 per cent to 32.4 per cent in the same period. The UST holdings share has been volatile in the past five years.
This isn’t a divestment in absolute terms (holdings remain high), but a relative decline due to:
Gold price surge
Broader reserve accumulation
Possible currency diversification
However, the share of market value of gold reserves in forex reserves has increased steadily between Mar2020 (6.2%) and Jun2025 (12%), with value increasing from USD 30.6 billion (653 million tonnes) to USD 84.5 billion (880 mt) -- but the increase is more pronounced since the start of Russia-Ukraine war.
The value and share of gold holdings are climbing more rapidly than UST.
This reflects:
Price appreciation of gold (more than 70% rise in three years).
Buying of more physical gold over the years.
Strategic allocation away from dollar-based assets.
Geopolitical risk hedging post-Russia-Ukraine war.
data sources:
Table 3: US Treasury Securities held by Foreign Residents
Top 20
--------------------------------------------------------------
Update 29Aug2025: Charts 115 and 116:
US Dollar Sale and Purchase by Reserve Bank of India: (old blog dated 05Aug2021 with monthly and yearly data for several years)
Two charts showing monthly and quarterly data of USD sales and purchases by RBI > Data avilable only till 30Jun2025 as RBI releases official data on currency intervention with a two month gap >
Between Apr2025 and Jun2025, RBI has been net seller in two months and net bought for one month,
with total sale amounting to USD 3.6 billion. Net sales in the past six
months amount to USD 2.0 billion and for the past one year, net sales
were USD 36.5 billion.
Year-to-date, the US dollar gained 2.97 per cent versus the Indian rupee -- conversely, INR lost 2.88 per cent vs the USD. Since the start of 2025, rupee has been volatile. It even appreciated to a level of 84 during the first week of May2025.
Even though, US dollar index (DXY), a guage of USD versus six major currencies, has fallen almost 10 per cent YTD, rupee has been under pressure due to Trump tariffs and RBI currency intervention (or lack of intervention) strategies.
As of today (29Aug2025), rupee closed at 88.18, its lowest in history versus the dollar.
Compared to Oct-Dec2024 period net sales of USD 44.7 billion, RBI currency intervention has been subdued in the period between Jan2025 and Jun2025.
Currency intervention:
During Oct2024-Jan2025 period, RBI resorted to heavy defence of rupee by resorting the USD combined sales of 55.79 billion. After Jan2025 till Jun2025, there is no significant intervention in currency markets to defend rupee. However, in Mar2025, RBI net bought USD 14.36 billion.
--------------------------------------------------------------
Update 21Jul2025: Chart 114:
Unsustainable US National Debt: America's national debt has been growing by leaps and bounds particularly since COVID-19 Pandemic, generally from the 2007/2008 Global Financial Crisis (GFC) and even prior to that from the Bush-era wars and tax cuts of 2002-2006.
The US national debt can be defined as the total amount of money the federal government owes to creditors. It represents the cumulative total of budget deficits over time—when the government spends more money than it receives in revenues.
As on date, the US national debt is USD 37.1 trillion. It has ballooned by USD 14 trillion or a staggering 60 per cent since the outbreak of COVID-19 Pandemic. Since COVID-19, the US federal government offered vast sums of stimulus to the public impacted by lockdowns and healthcare crisis.
25-year Growth:
In the past 25 years, the national debt has grown at an annualised rate of 7.8 per cent (555 per cent absolute growth) from USD 5.7 trillion to USD 37.1 trillion now (see chart below).
Two high-growth phases:
One is after the GFC between 2007 and 2010.
Another is after the COVID-19 Pandemic.
10-year Growth:
The national debt recorded a growth of USD 19 trillion or more than doubled between 2015 and now, recording an annualised growth of 7.4 per cent.
5-year Growth:
In the past five years, the debt has grown by 38 per cent, at an annualised rate of 6.6 per cent.
Five Reasons why US national debt is unsustainable:
1. The US economy growth rates at 3 to 4 per cent are much lower compared to 7.8 per cent annualised growth in national debt in the past 25 years.
2. In
the last four years, the US interest rates have remained elevated, with
the current Federal Funds rate at 4.25-4.50 per cent. Higher interest
rates are definitely going to increase the interest cost burden for the
federal government in future.
3. High debt limits the government’s ability to respond to future crises (for example, a run on the dollar, another pandemic, financial collapse or any war).
4. Eroding investor confidence: As debt balloons, investors (especially foreign ones) may demand higher interest rates to lend money to the US, or reduce their holdings of US Treasuries. This raises borrowing costs and could weaken the dollar’s status as the global reserve currency.
As we've seen in April and May of this year, foreign investors heavily sold off US dollar assets, like, Treasury bonds and US stocks and the US dollar itself lost 10 per cent of its value recently against a basket of currencies (see update 01Jul2025 with charts 103 and 104 below for DXY fall).
5. The One Big Beautiful Bill Act (OBBBA) signed into law by President Trump is further going to exacerberate the national debt position, according to Congressional Budget Office (CBO) estimates.
As per CBO, the Act will add USD 1.8-2.2 trillion to the national debt over 10 years (2025-2035).
Chart showing US National debt by year from 1999 to 2025:
--------------------------------------------------------------
Update 09Jul2025: Charts 112 and 113:
India Balance of Payments (BoP): Yearly BoP data for 11 years with definitions: India
overall balance of payments - goods / merchandise exports and imports,
trade deficit, net invisibles, services exports / imports, services
trade suplus, net transfers, net income, current account deficit (CAD),
capital account, foreign direct investment (FDI flows), foreign
portfolio flows (FPI flows in debt and equity segments), external
assistance, external commercial borrowings (ECBs), NRI deposits and
others
(For detailed analysis of India's BoP, please check update 29Jun2025 with chart 101 below)
Balance of Payments (BoP): Growth rates of components of India's BoP for the past one year, 3-year, 5-year and 10-year periods. The growth rates are absolute, not annualised.
Observations from the two charts below:
1. Services exports dominance: As noted earlier, India is a powerhouse of services exports and it is often dubbed by experts as "Office of the world."
In India's current account, invisibles are greater than goods trade.
As argued by RBI former governor Raghuram Rajan for several years, India's strength lies in services exports, and Indian government's fetish for goods exports (via government initiatives like "Make in India" and PLI or production linked incentive scheme) is unwarranted.
As shown in the charts below, goods exports growth (absolute) is just 39.6 per cent in the past 10 years, whereas services exports growth is 145.1 per cent -- and the 5-year growth rates are 37.9 and 81.8 per cent respectively. One could also check growth rates for one-year and 3-year periods also. All data for growth rates is as at FY 2024-25 end.
From USD 158.1 billion in 2014-15, India's services exports (part of Invisibles) increased to USD 387.5 billion in 2024-25.
In fact, 3-year goods exports growth is a piffling 2.9 per cent -- a poor reflection on the initiatives of the Indian government, though some part of the tepid growth could be attributed to external factors.
As against the goods exports growth of 39.6 per cent in the past 10 years, India's goods imports rose by 58 per cent, resulting in 10-year growth of 98.2 per cent in trade deficit.
India's services exports mainly consist of information technology and knowledge-based services. The components are:
Software services (for example, IT and ITeS exports)
Travel and tourism
Transportation
Insurance and pension services
Financial services (accoounting, auditing and financial analysis)
Communication services
Construction services
Other business services
2. Gross invisibles: As stated earlier, invisibles are exports that cannot be touched or seen. They consists mainly of services, transfers and income.
The 10-year and 5-year growth rates for gross invisibles are 131.7 and 77.2 per cent respectively -- the growth is driven primarily by services exports and net transfers (mainly NRI / inward remittances).
The 10-year and 5-year growth rates for net transfers are 88 and 64.2 per cent respectively. They rose from USD 65.7 billion in 2014-15 to USD 123.5 billion in 2024-25.
The 10-year and 5-year growth rates for services imports are 143.6 and 54.9 per cent respectively.
Net invisibles are equal to gross invisibles minus services imports (check charts below for data).
3. Current Account Balance (CAB): India's trade deficit grew from USD 144.9 billion in 2014-15 to USD 287.2 billion in 2024-25, a growth of almost 100 per cent. In the same period, services trade surplus (excess of services exports over services imports) grew from USD 76.5 billion to USD 188.8 billion, a growth of 146.7 per cent.
Because of services trade surplus, India's current account deficit has been in control over the past 10 to 11 years. In fact, India's current account deficit declined from USD 26.9 billion in 2014-15 to USD 23.4 billion in 2024-25.
4. Capital Account: India has been doing very poorly in foreign direct investment inflows front. The data bear this out explicitly. FPI flows too are not great. (for FDI flows, see update 16Jun2025 with charts 91 and 92 and for FPI flows, see update 05Jul2025 with charts 105 to 108 below).
5. NRI Deposits: Inflows of deposits from non-resident Indians (NRIs) have been volatile in the past 10 years. The net NRI deposits flows grew from USD 14.1 billion in 2014-15 to USD 16.2 billion in 2024-25, a lacklustre growth of 15.2 per cent.
In 2016-17, there were outflows of USD 12.4 billion in NRI deposits. This was due to lumpy and large-scale redemptions of FCNR (B) deposits during the year.
It may be recalled: NRI deposits inflows were unusually high at USD 38.9 billion in 2013-14, as RBI allowed banks in India to raise FCNR (B) deposits at concessional rates of interest with RBI providing a special swap window for banks. This was done to arrest the fall of rupee as part of post Fed Taper Tantrum measures.
Charts below:
Growth rates in Goods / Services exports for the past one-year, 3-year, 5-year and 10-year periods:
India Balance of Payments - Trade deficit, current account deficit and others:
Charts 112 and 123 Click on the chart view better >
--------------------------------------------------------------
Update 06Jul2025: Chart 111:
MSCI EM Index - China and India weights: Quarterly changes between Mar2025 and Jun2025: (for old data, see old blogs dated 07Jan2023 and blog 03Aug2021)
India's rank in the MSCI EM Index has slipped from second in Mar2025 to third rank in Jun2025. Taiwan regained second rank in Jun2025. There is a see-saw battle between India and Taiwan for second rank in the past five quarters.
Taiwan's ranking has gone up due to rise in the stock price of semiconductor giant TSMC, with a weight of 10.2 per cent as at the end of Jun2025.
As
of Jun2025, India's weight is 18.12 per cent in third place; while
China maintains its first rank with 28.42 per cent weight. Brazil in fourth place. It is noteworthy only top five countries account for 80 per cent of the weight in MSCI EM index.
The chart below looks at the past five quarters data, with valuation ratios, top five countries and top five companies (for old data see update 06Jan2025 with chart 50 below).
Three Indian companies are in the top ten of the list.
Changes in the past one year: China weight increased from 25.1 to 28.4 per cent between Jun2024 and Jun2025 while that of India decreased from 19.2 to 18.1 per cent (India suffered heavy selling between Oct2024 and Mar2025). In the same period, weights of South Korea and Taiwan have gone up.
For almost five years, Taiwan's TSMC maintains its rank as the number one company with highest weight in MSCI EM index. TSMC alone accounts for more than 50 per cent weight for Taiwan.
Fun fact: At one time, Russia had 10% weight in MSCI EM index -- its weight fell to less than 2% in 2022. It was removed from the index in the same year.
--------------------------------------------------------------
Update 05Jul2025: Charts 109 and 110:
FPI AUC data: FPI / FII AUC data: Assets under custody (AUC) data of foreign portfolio investors (FPIs):
(for old data > Old blog dated 10Jul2022 - Exit India Policy by Foreign Investors; and old blog dated 28Apr2022 - Foreigners' Shrinking Pie in Indian Equities)
FPI
equity assets, as on 30Jun2025, are Rs 74.2 lakh crore, showing an
annual growth (year-on-year) of 3.8 per cent in rupee terms. While in dollar terms they
are at USD 865 billion, with a yearly growth of 1 per cent.
In
the same period, BSE market cap rose by 5 per cent to Rs 461 lakh
crore, with Nifty 50 growing by 6.3 per cent and BSE 200 by 4.4 per
cent. The BSE market cap growth is slightly higher compared to rise of BSE 200, as there have been a number of new listings (initial public offers or IPOs) and follow on public offers (FPOs) in the past one year.
Equity
AUC assets held by FPIs are just 16.1 per cent of total market cap of
all BSE listed firms as of 30Jun2025. The percentage of equity assets
held by FPIs is slightly lower compared to 16.2 per cent as at the end
of 31Mar2025.
FPI investors have been losing interest considerably in Indian stocks in the past four years -- their share has come down
from almost 20 per cent in Mar2021 to 16 per cent now; domestic
investors' share has been rising gradually during the period.
Total
assets (including equity and debt) in India held by FPIs are under USD 1 trillion achieved as of 30Sep2024.
The following charts provide data of equity AUC from Mar2017 till Jun2025.
In the past one year, the growth in equity AUC held by FPIs is much lower at 1 per cent (in rupee terms)
compared to the growth of 14.2 per cent in debt AUC -- this is due to huge
FPI inflows into debt segment in 2024 as India government bonds were included in JP Morgan and Bloomberg emerging market indices in Sep2023 and Mar2024 respectively
--------------------------------------------------------------
Update 05Jul2025: Charts 105 to 108:
FPI Equity Flows to India : Foreign
Portfolio flows: 15-month FPI flows to India in the equity segment (old blog 10Jul2022) > 15-quarter flows also >
FPI Debt Flows to India : Foreign
Portfolio flows: 15-month FPI flows to India in the debt segment > 15-quarter flows also >
FPI Equity Flows: The
data include Sensex and BSE 200 levels as at the end of the respective
quarter / month -- which will enable the readers to discern the impact
of FPI outflows / inflows on the Indian stock market.
After
heavy selling between Oct2024 and Mar2025 (with a total outflow of Rs
2.17 lakh crore), foreign portfolio investors (FPIs) turned positive in
the months of April, May and Jun2025, as per data from NSDL.
The total FPI equity inflows were Rs 38,673 crore during Apr-Jun2025 quarter. Year-to-date outflow is Rs 77,901 crore; for the past one year, total outflows is Rs 80,675 crore; total inflow for the past two years is only Rs 17,226 crore; and total inflow for the past three years is Rs 189,552 crore.
As the total share of FPIs in Indian stock market has been declining steadily over the years, their influence on market has markedly come down. However, the dramatic outflow of Rs 2.17 lakh crore during Oct2024-Mar2025 has indeed negatively impacted Indian stocks.
FPI Debt Flows: The
following charts include monthly and quarterly data of FPI or
foreign portfolio investor flows into the Indian debt market. The data
for debt include VRR, FAR, hybrid, MF, etc.
The
charts also include month- and quarter-end levels of India benchmark
10-year G-Sec yield, so that readers can discern the impact of debt
flows on the Indian debt / G-Sec market.
During Apr2025 and Jun2025, FPI turned negative on Indian debt market with outflows of Rs 24,413 crore and Rs 22,153 crore respectively.
For six quarters between Oct2023-Mar2025, the FPI debt flows were positive in all quarters. However, for the first time since Oct-Dec2022 quarter, their flows turned negative in Apr-Jun2025 quarter with outflows of Rs 35,476 crore.
Four charts showing FPI Equity and FPI Debt flows > past 15-month as well as past 15-quarter data >
--------------------------------------------------------------
Update 01Jul2025: Charts 103 and 104:
Global market data: Global market data pertaining to stocks, bonds,
commodities and currencies are presented here (old blog dated 29Jun2024).
Quarter-to-date
(QTD) global market data, as on 30th of June, 2025, of stocks, bonds,
currencies and commodities is as follows:
During Apr-Jun2025 quarter (QTD), Nasdaq Composite is the biggest gainer among major indices with a gain of 17.8 per cent followed by Nikkei 25 (13.7 per cent) and S&P 500 (10.6 per cent).
Sensex and Nifty 50 gained 8 and 8.5 per cent respectively. Hang Seng and Shanghai Composite in contrast showed anaemic growth.
Despite rampant trade protectionism and threat of Trump tariffs, Russia-Ukraine war, Gaza genocide and Israel and US strikes on Iran, the global markets have made significant gains in the second quarter despite stomach-churning intra-quarter volatility.
The US Treasury yields went up significantly due to concerns about US fiscal deficit, Trump tariff tantrums, erosion of dollar value versus major currencies and exodus of money from US assets to Europe and other nations.
Whiile the US 10-year Treasury yield declined by 2 basis points, India 10-year benchmark yield fell by 27 bp; with the yield spread climbed to 29 bp as on 30Jun2025 versus 19 bp as on 31Mar2025.
Among risky assets, Bitcoin in USD is the biggest gainer with a gain of 30 per cent in Apr-Jun2025 quarter.
Crude oil fell by up to 9.5 per cent with higher supply from OPEC+, despite Israel / US strikes on Iran. Gold and silver continued to climb, though they retreated a bit in the past two weeks.
The US dollar index or DXY fell by 7.1 per cent with the Euro and pound sterling getting stronger agains the US dollar. Indian rupee and Chinese yuan barely moved.
Overall, despite heightened volatility and geopolitical tensions, global financial markets on the surface appear to be okay.
During Jan-Jun2025 half-year (YTD), the biggest stock market gainers are Dax 40 and Hang Seng each chipping in with gains of 20 per cent each.
Gold and silver too have done well in the first half of 2025 with gains of 26 and 23 per cent respectively. Bitcoin gained around 15 per cent and crude oil declined almost 10 per cent.
The US dollar index or DXY fell by as much as 11 per cent, with the Euro gaining the most. Due to uncertainty surrounding Trump reciprocal tariffs, flow of money out of the US into Europe and others, Euro seemed to have made significant gains versus the US dollar.
Two charts showing QTD and YTD data >
please click on the images to view better >
--------------------------------------------------------------
Update 30Jun2025: Chart 102:
India Balance of Payments (BoP): India current account surplus versus current account deficit: India CAD data: quarterly CAD data with 100 quarters CAD data:
In
the past 25 years, India experienced current account surplus only in
four years, and in the rest of the years, it was current account
deficit (see update 28Jun2025 with Chart 99 below).
An
analysis of India's current account balance (CAB) over the past 25
years (2000-01 to 2024-25) provides a detailed look into the trends and
patterns of the current account surplus and deficit.
Here are the key
insights: please check a comprehensive blog dated 30Jun2025 "The Elusive Current Account Surplus: What 25 Years of Data Reveal About India's Trade Balance."
India Current Account Balance - Quarterly / Yearly Data >
Current Account Surplus Amidst Tepid Economic Growth
chart 102 click on the image to view better >
--------------------------------------------------------------
Update 29Jun2025: Chart 101:
India Balance of Payments (BoP): yearly BoP data - 11 year BoP data with definitions: India overall balance of payments - goods / merchandise exports and imports, trade deficit, net invisibles, services exports / imports, services trade suplus, net transfers, net income, current account deficit (CAD), capital account, foreign direct investment (FDI flows), foreign portfolio flows (FPI flows in debt and equity segments), external assistance, external commercial borrowings (ECBs), NRI deposits and others
Balance of Payments (BoP):
Goods exports: Over the past five years, India's growth in merchandise exports has lagged behind the growth in imports, leading to a near doubling of the trade deficit. This widening gap in goods trade has put pressure on the current account.
India's goods exports rose from USD 320 billion in 2019-20 to USD 442 bn in 2024-25, showing an absolute growth of 37.9 per cent. India's
goods imports rose from USD 478 bn in 2019-20 to USD 729 bn in
2024-25, showing a growth of 52.5 per cent. This has led to 82.3 per cent growth in trade deficit from USD 158 bn to USD 287 bn.
Services exports: In contrast, India’s services exports have emerged as a key driver of economic growth. The services trade surplus (excess of services exports over services imports) has more than doubled over the same period, underscoring the sector’s increasing importance in India's external sector performance.
The robust performance of services exports—particularly in information technology, business services and digital solutions—has contributed significantly to job creation, helped stabilise the Indian rupee and supported the accumulation of foreign exchange reserves.
Crucially, the surplus generated from services exports has played a vital role in offsetting the growing merchandise trade deficit, thereby helping to keep the current account deficit within manageable limits despite tepid goods exports.
India's services exports rose from USD 213 billion in 2019-20 to USD 388 bn in
2024-25, showing an absolute growth of 81.8 per cent. India's services imports rose from USD 128 bn in 2019-20 to USD 199 bn in
2024-25, showing a growth of 54.9 per cent. This has led to 122 per cent growth in services trade surplus from USD 85 bn to USD 189 bn.
Net transfers: Between 2019-20 and 2024-25, net transfers (including NRI / inward remittances) delivered a growth of 64 per cent from USD 75 bn to USD 124 bn.
Foreign Direct Investment or FDI Flows: In the past five years, FDI flows have collapsed by a staggering 97.7 per cent (see charts 91 and 92 below), reflecting poorly on the economic policies of PM Modi Government.
Foreign Portfolio Investment or FPI Flows: FPI flows to India have been tepid in recent years. For five financial years from 2020-21 to 2024-25, net FPI flows amounted to USD 27.5 bn.
As of now, India’s total market cap stands at USD 5.38 trillion (or Rs 460 lakh crore), according to data from bseindia.com. In comparison, FPI flows amounting to USD 27.5 bn, for five years from 2020-21 to 2024-25, represent a relatively small share of the overall market size.
The FPI share in India's total market cap, currently at 16.2 per cent, has been declining steadily in recent years. This trend reflects the increasing dominance of domestic investors, including EPFO investments, mutual funds and retail investors (see FPI AUC charts 66 to 68 below).
Components of Balance of Payments (BoP):
India’s Balance of Payments (BoP) is divided into two main accounts: the Current Account and the Capital Account (sometimes grouped with the Financial Account). These accounts record all economic transactions between India and the rest of the world.
Two components of current account are: Merchandise trade (exports and imports of goods) and Net Invisibles.
In India's Balance of Payments (BoP) data, the "Net Invisibles" are a crucial component of the Current Account. They essentially represent transactions that don't involve the physical movement of goods.
Key items in net invisibles are:
1. Services exports and imports
2. Net transfers (net secondary income)
3. Net income (net primary income)
Net transfers (net secondary income) are receipts or payments that do not involve any value in exchange, meaning there's no quid pro quo. They are essentially one-way transactions. The components of Net transfers are:
Private Transfers: This is the most significant component for India. It largely consists of remittances sent by Indians working abroad to their families in India (NRI remittances or inward remittances). India is one of the largest recipients of remittances globally.
Official Transfers: These include grants, aid, and donations received from or given to foreign governments or international organisations.
Net income or net primary income (also known as factor income): This refers to income earned by factors of production (labour and capital) across international borders. Primary income is money earned from production / work ((Interest, dividends and seasonal worker wages). The components of Income are:
Compensation of Employees: This includes wages, salaries and other benefits earned by non-residents working in India, and by Indian residents working abroad (for example, Indian professionals working in the Middle East or developed countries).
Investment Income: This covers income generated from financial investments. It includes dividends and profits on foreign direct investment (FDI) and foreign portfolio investment (FPI).
Traditionally, India runs a trade deficit in Goods; whereas in Services sector, we have consistently maintained services trade surplus.
Capital Account:
The Capital Account, along with the more dominant Financial Account, records capital flows — money moving in and out of India for investments and loans.
Key Components:
Foreign Direct Investment (FDI): Long-term investments in productive assets (for example, factories, companies)
Foreign Portfolio Investment (FPI): Volatile capital flows (hote money) that move in and out of stock and debt markets
External assistance: Reflects Indian federal government's borrowing and repayment activities with sovereign and multilateral entities, like, World Bank, IMF and ADB
External Commercial Borrowings (ECBs): Loans raised by Indian companies from foreign lenders
NRI Deposits: Funds deposited by NRIs in Indian banks
Banking Capital: Transactions related to deposits and loans between banks and foreign entities
Reserve Assets (Managed by the RBI): Changes in foreign exchange reserves also reflect capital account movements.
Note 1: for simplicity, the items under banking capital and reserve assets are shown as item: E) Others in the chart below, with suitable adjustments in data.
Note 2: Item II A (C) Services balance (surplus + / deficit -) shown in the below chart is formally known Services Trade Surplus
Abbreviations: NRI - non resident Indians; USD - US dollar
Data sources:
RBI press releases on 27Jun2025:
Developments in India's Balance of Payments during the fourth quarter of FY 2024-25. Sources of variation in India Forex Reserves FY 2024-25
Table 130: India’s Overall Balance of Payments - USD
Table 134: Key Components of India’s Balance of Payments - USD
Table 236: Balance of Payments (BoP) Indicators
RBI DBIE: Home > Statistics > External Sector > International Trade Table 130: India overall Balance of Payments
As RBI does not provide data in a fashion that is desirable by common readers, the author has to collect data presented in the chart below from various RBI sources; and accordingly data have been altered suitably for presentation purposes.
Data for 11 years from 2014-15 to 2024-25 >
chart 101 click on the image to view better >
--------------------------------------------------------------
Update 28Jun2025: Chart 100:
India External Debt Indicators : (old blog 10Nov2023 India Forex Reserves Comfortable)
India’s external debt remains manageable according to current external debt indicators.
As of Mar2025, India’s forex reserves are sufficient to cover its external debt obligations. However, the ratio of forex reserves to total external debt has decreased slightly, from 96.7 per cent in Mar2024 to 90.8 per cent in Mar2025.
India's external debt to GDP ratio stands at 19.1 per cent in Mar2025, which indicates a moderate level of external debt. This suggests that India is in a position to withstand external economic shocks in the near term.
Other vulnerability indicators like, import cover, too are comfortable. Import cover, as of Dec2024, is 10.5 months. Import cover is number of months of imports forex reserves could pay for.
Short term debt (original maturity) to total debt is below 20 per cent, which is a healthy indicator.
Overall, the external debt indicators, as shown in the accompanying chart, reflect that India’s external debt is low to moderate and remains manageable.
With adequate foreign exchange reserves, India is well-prepared to handle any potential financial exigencies.
Despite the healthy overall position on the external front, there are a few areas of concern: One is the collapse of net FDI flows (see charts 91 and 92 below) from USD 43 billion in 2019-20 to just USD 1 billion in 2024-25.
The second is tepid foreign portfolio flows (FPI flows in equity segment). In the passt five years, India could attract only Rs 1.67 lakh crore for equity FPI flows in the past five years.
Merchandise trade deficit is another weak spot. India's forex reserves are buttressed (not by trade surplus from exports as is the case with countries like China and Japan) by foreign direct investment and volatile capital flows (hot money). India's merchandise exports continue to be weak though we're doing well on services exports.
Note on Debt Service Ratio:
In the context of India's external debt, the debt service ratio is a key indicator of a country's ability to meet its external debt obligations. It measures the proportion of a country's external current receipts that is used to service its external debt.
The debt service ratio is calculated as:
Debt Service Ratio = Gross debt service payments (principal + interest) divided by external current receipts
Where:
Gross debt service payments include both the principal and interest payments due on all external debt during a specific period.
External current receipts primarily refer to a country's export earnings (from both goods and services) and other current transfers received from abroad.
If the debt service ratio (DSR) has increased in a year compared to the previous year, it indicates a deterioration in a country's ability to service its external debt obligations. So, the lower the debt service ratio, the better.
Data source:
RBI press releases on 27Jun2025:
Developments in India's Balance of Payments during the fourth quarter of FY 2024-25. Sources of variation in India Forex Reserves FY 2024-25
Table II 7.4 (page 84) of RBI Annual Report 2024-25 - import cover and other data points
--------------------------------------------------------------
Update 28Jun2025: Chart 99:
India current account deficit (CAD) : India CAD data: yearly CAD data: During
FY 2024-25, India's CAD declined to 0.6 per cent of GDP or gross domestic
product from 0.7 per cent of GDP in FY 2023-24, as per latest RBI press release dated 27Jun2025 on "Developments in India's Balance of Payments during the fourth quarter of FY 2024-25."
(as per RBI annual report 2024-25, CAD was 1.3% of GDP for FY 2024-25 [see chart 77 below], which was revised down to 0.6% as per RBI press release on 27Jun2025)
RBI press releases on 27Jun2025:
Developments in India's Balance of Payments during the fourth quarter of FY 2024-25. Sources of variation in India Forex Reserves FY 2024-25
RBI press release 30Apr2025 - Data on India’s Invisibles for Third Quarter (October-December) of 2024-25
RBI press release 30May2025 Monthly Data on International Trade in Services for Apr2025
chart 99 click on the image to view better >
--------------------------------------------------------------
Update 26Jun2025: Chart 98:
India Strategic Petroleum Reserves or SPR (Tweet 26Jun2025 on India energy security and SPR):
India's SPR are low at 5.33 million metric tonnes or nearly 37 million barrels. Our reserves may not even last seven days of oil consumption (see chart below).
IEA (International Energy Agency) members are mandated to have 90 days of net imports as reserves.
India's SPR locations are: Visakhapatnam, Mangalore and Padur (near Udupi). They are constructed in underground rock caverns.
In Mar2025, Gov't of India announced they would expand SPR facilities to two more sites: Chandikhol (Orissa) and Padur (Karnataka) with 6.5 million metric tonnes capacity.
US EIA or Energy Information Administration
World's top 10 countries by crude oil consumpiton and their SPR >
--------------------------------------------------------------
Update 23Jun2025: Charts 93 to 97:
India's crude oil dependency: (old blog dated 25Sep2023 with updates) India's
crude oil import dependency was 88.2 per cent during FY 2024-25, as per
latest data from PPAC, a Government of India body.
While India produced just 28.7 million metric tonnes (MMT) of crude oil in 2024-25, its imports amounted to 243 MMT -- resulting in oil dependency of 88.2 per cent for the year.
As chart 1 below shows, India's oil dependency progressively increased to 88.2 per cent in 2024-25 from 77.6 per cent during 2013-14. Energy security is a neglected baby in India.
India's total crude oil output fell by 24 per cent between 2013-14 (37.8 MMT) and 2024-25 (28.7 MMT), under the watch of PM Modi government. In the same period, crude oil imports surged by 28.4 per cent, resulting in India's rising import dependency of crude oil (see charts 1 and 2 below).
The main reasons for India's rising oil import dependency are:
> failure of central government's efforts to attract foreign investments (the renamed HELP or Hydrocarbon Exploration and Licensing Policy has not helped to attract any meaningful investments)
> despite increased investments, the state-owned ONGC Ltd has flopped in producing more -- in fact, its output fell by 14.7 per cent between 2013-14 and 2024-25 (chart 2 below)
> lack of private investments and success in finding new wells has resulted in fall of output by 53 per cent from joint ventures / private sector (chart 2 below)
> administered consumer prices and oil / gas subsidies (especially during elections) act as a disincentive for private / foreign firms to invest in oil / gas exploration in India - (remember the fracas between the erstwhile Cairn India and Govt of India?)
> the world over, new investments in fossil fuels have fallen due to increased emphasis on renewable energy sources and focus on net zero initiatives -- however, in India's case, we still need fossil fuels as India is the one of the largest economies that has been growing at reasonable growth and India's oil consumption is expected to go up further for another one or two decades
> Reneweable energy is still just 6.1 per cent of India's total energy basket as per 2023 data from PPAC (coal 56.3%, Oil 27.1%, natural gas 5.8%, hydro 3.6%, etc.)
Data sources:
PPAC Cell, Govt of India FY 2024-25 Ready Reckoner (114-page PDF)
PPAC Cell, Indigenous crude oil production
References:
Tweet 22Mar2026 Oil minister Mani Shankar Aiyar talked about India energy security (images) -blog dated 05Feb2010 Oil subsidy burden: Kirit Parikh Committee Recommendations (several topics were covered in this comprehensive blog)
Tweet 16Mar2026 coal is king / king coal - energy short
Tweet 11Mar2026 For India, coal and oil are still kings / king coal / king oil
Tweet 09Mar2026 Energy security neglected baby in India - increased oil import dependency (data image) - 25% fall in India oil output under PM Modi
Tweet 12Feb20026 India coal demand rises - COP26 - India net zero by 2170! 😍
Tweet 12Dec2025 India coal power capacity boost to augment India energy security - COP26
Tweet 26Jun2025 India energy short - need to stock up on SPR
Tweet 23Jun2025 main reasons for increasing India oil import dependency (with image)
Tweet 20Mar2025 coal backlash undermines India energy security push
Blog dated 25Sep2023 India's Crude Oil Import Dependency Jumps Under Modi
Tweet 03Jul2021 Oil savings (2015-2020) should have been oil for building strategic oil reserves or SPR
Tweet 12May2020 energy security key for India
Tweet 12May2020 India oil dependency rising (image)
Tweet 12May2020 past 20 year data (image) of India oil output -- cosmetic name change from NELP to HELP
Tweet 12May2020 Strategic petroleum reserves SPR
Tweet 02Nov2018 Governments' failure to derisk Indian economy with SPR
Tweet 19Jun2017 No attempt by India to build SPR
Tweet 19Jun2017 savings from lower crude oil prices (2015-2017) should have been used for shoring up SPR
Tweet 23Jan2016 Building SPR topmost priority for India
Tweet 23Apr2015 SPR photo gallery
Tweet 08Jan2015 willingness and wherewithal to build SPR?
Supporting screenshots downloaded from PPAC >
--------------------------------------------------------------
Update 16Jun2025: Charts 91 and 92:
Foreign Direct Investment flows : (old blog 25May2022, Tweet thread 25May2022 and Tweet thread 19Jan2024) India FDI Flows: Gross FDI flows and net FDI flows data >
Net foreign direct investment (FDI) flows to India in FY 2024-25 were just USD 0.4 billion, the lowest in several decades.
In FY 2024-25, gross FDI inflows were USD 81 billion and FDI repatriated was USD 51.5 billion -- resulting in FDI to India (gross FDI minus repatriation) of USD 29.6 billion (see chart below for data).
The growth in gross FDI inflows was 13.7 per cent in the last financial year, while FDI repatration rose by 15.8 per cent.
However, FDI by India spiked by 75.1 per cent in 2024-25 to USD 29.2 billion -- with the result, net FDI to India collapsed by 96.5 pere cent from USD 10.1 billion in 2023-24 to just USD 0.4 billion in 2024-25.
Possible reasons for collapse of FDI flows in recent years:
Foreign companies operating in India have repatriated more money as dividends and other payments. In 2024-25, FDI repatriated out of India grew by 15.8 per cent to USD 51.5 billion.
Indian companies seem to be finding foreign markets more attractive to invest rather than in India -- which is reflected in the 75 per cent growth in FDI by India in 2024-25.
Multi national corporations (MNCs) in India have sold off their stakes in their operating companies in India, capitalising on the elevated levels of Indian stock market in the first half of 2024-25.
For example, South Korea's Hyundai Motor cashed out its holdings in Hyundai Motor India partially through a public offering (IPO). Several private equity (PE) and venture capital funds too have sold large stakes in Indian firms. Other examples include: Whirlpool sells its stake partailly in its Indian arm, BAT in ITC Ltd, Timken, Singtel in Bharti Airtel and Vodafone in Indus Towers.
More
multi national companies (MNCs), like, LG Electronics India, are
planning to to come out with public offerings and exit India
partially.
Last month, India's Supreme Court cautioned that rigid enforcemnt of rules ignoring market effects would be detrimental to India's aspirations of becoming a global manufacturing hub.
India's share in global FDI flows has come down in recent years.
The track record of PM Modi government in forging trade agreements is pathetic; in several cases, India has failed to implement the free trade agreement (FTA) and bilateral trade agreements properly. India scrapped bilateral trade agreements (BTA) too.
In Dec2024, Switzerland had withdrawn Most Favoured Nation (MFN) status to India, in retaliation to Nestle India court case -- in which India's Supreme Court ruled Nestle India to pay higher taxes on dividend payments to its Swiss parent.
Even though the government claims to be a proponent of ease of doing business, it's still poor in India. 'Red Tape' is still rampant -- decision-making is tardy very often.
Delays in tax appeals, legal delays and rectification orders / refunds frustrate investors. There is a wide chasm between policy and implementation.
India has FDI investment caps on 40 sectors ranging from retail trade to insurance, deterring foreign investors from investing in India.
As part of China Plus initiatives, India was supposed to benefit from them, but the actual beneficiaries are Vietnam and South Korea.
In general, weak Rule of Law, high trade protectionism, investment restrictions in India's several sectors and unstable tax policies have negatively impacted sentiments of foreign investors, though PM Modi government has provided political stability in the past 10 years.
Dismal track record on attracting FDI in the past 10 years:
The track record of PM Modi government in attracting net FDI inflows to India is so abysmal that in the past 10 years, the net FDI to India plumetted by 98.9 per cent from USD 31.3 billion in 2014-15 to USD 0.4 billion in 2024-25 (see below chart for data).
Though gross inflows in the past 10 years grew by 79.5 per cent, the FDI repatriated rose by 422 per cent and FDI by India surged by a staggering 624 per cent.
(note: in the next 10 days, RBI is likely to release two press releases, namely, Sources of Variation in India’s Foreign Exchange Reserves during April-March 2024-25 and Developments in India’s Balance of Payments during the Fourth Quarter (January-March) of 2024-25 -- so please watch out for them for any revisions in FDI data)
FDI flows data sources:
RBI monthly bulletin May2025 - Table 34 Foreign investment inflows RBI DBIE - Foreign investment inflows (updates very late)
All data on gross FDI flows, FDI repatriated, FDI to India, FDI by India and Net FDI to India for the past 19 years from 2006-07 to 2024-25 >
--------------------------------------------------------------
Update 15Jun2025: Chart 90:
India Forex Reserves Data: old blog dated 18May2022 (the blog has data from 1999-2000 onwards) and another old blog dated 10Nov2023 (with data on FPI AUC, FPI equity assets, FPI flows, FDI flows, India CAD, import cover, short term foreign debt, volatile capital flows, RBI earnings rate and external vulnernability indicators) >
In FY 2024-25, India's forex reserves rose by USD 21.9 billion, one of the slowest accretions in the past six years (except in 2022-23 that experienced depletion). RBI resorted to heavy forex intervention during 2024-25, with net USD sale of USD 34.5 billion -- leading to slower growth in RBI forex reserves.
But for the increase in the value of RBI gold holdings (due to a combination of sharp rise in dollar gold price internationally and new physical gold bought by RBI) in 2024-25, India's forex reserves would have dwindled in that year (see Update 05May2025 with charts 74 to 76 for RBI gold holdings).
Chart showing India's foreign exchange reserves data from FY 2009-10 till FY
2024-25. Chart also shows accretion and depletion of forex reserves
during a financial year; USD sale and purchase by RBI during a financial
year and USD - INR level at the end of a financial year >
--------------------------------------------------------------
Update 15Jun2025: Charts 88 and 89:
US Dollar Sale and Purchase by Reserve Bank of India: Data on Direct Forex intervention by RBI (old blog dated 05Aug2021 with monthly and yearly data for several years)
Two charts showing monthly and quarterly data of USD sales and purchases by RBI >
Between Oct2024 and Feb2025, the RBI undertook sustained interventions in the foreign exchange market, selling a net total of USD 57.4 billion -- primarily to stabilise the rupee against the dollar. In a notable shift in Mar2025, the RBI resumed dollar purchases, buying USD 14.4 billion.
In the second half FY 2024-25, the FPIs resorted to heavy selling in Indian stock market, forcing to the RBI to intervene in forex markets (see update 15Jun2025 with chart 85 for FPI equity flows data).
For the full financial year 2024-25, the RBI forex intervention totaled with net US dollar sales of USD 34.5 billion.
During FY 2024-25, dollar gained 2.8 per cent versus the rupee, with the exchange rate moving from 83.37 as at end-Mar2024 to 85.75 at the end of Mar2025 (see Update 30Mar2025 and charts 63 to 64 for Dollar Rupee exchange rate and dollar gain versus rupee data for 25 years).
USD sales and purchases by RBI > monthly data from Jan2024 to Mar2025; and quarterly data from Jan-Mar2020 to Jan-Mar2025 >
(note: for financial-year wise data of USD sale and purchase by RBI, see update 15Jun2025 with chart 90)
--------------------------------------------------------------
Update 15Jun2025: Charts 86 and 87:
FPI Debt Flows to India : Foreign
Portfolio flows: 15-month FPI flows to India in the debt segment >
The following two charts include monthly and quarterly data of FPI or foreign portfolio investor flows into the Indian debt market. The data for debt include VRR, FAR, hybrid, MF, etc.
The charts also include month- and quarter-end levels of India benchmark 10-year G-Sec yield, so that readers can discern the impact of debt flows on the Indian debt / G-Sec market.
FPI debt flows were negative at Rs 24,400 crore in Apr2025. However, they turned positive in May2025 (see chart below for monthly data), as per data from NSDL.
In Jun2025, they resumed selling with net sales of Rs 26,650 crore so far.
Year-to-date (till 13Jun2025), FPI debt flows are positive at Rs 8,070 crore.
Bond inclusion: What is remarkable is FPI debt inflows have been quite robust in the past 20 months or so. The turning point is the inclusion of India bonds in international bond indices.
After the announcement of JP Morgan including India government bonds in their EM indices in Sep2023 and the inclusion of Indian government bonds in Bloomberg EM
indices in Mar2024, FPI flows to Indian bond market have accelerated.
Between Oct2023 and now, FPI debt inflows to India are to the tune of Rs 2.14 lakh crore, though they were net sellers in the month of Apr2025 (see chart below for quarterly data).
Overall, this is a positive development for foreign portfolio flows to
India.
Monthly data >
Quarterly data >
--------------------------------------------------------------
Update 15Jun2025: Chart 85:
FPI Equity Flows to India : Foreign
Portfolio flows: 18-month FPI flows to India in the equity segment (old blog 10Jul2022) >
The
data include Sensex and BSE 200 levels as at the end of the respective
quarter / month -- which will enable the readers to discern the impact
of FPI outflows / inflows on the Indian stock market.
After heavy selling between Oct2024 and Mar2025 (with a total outflow of Rs 2.17 lakh crore), foreign portfolio investors (FPIs) turned positive in the months of April and May 2025, as per data from NSDL.
Total FPI inflows in Apr2025 and May2025 amount to nearly Rs 24,100 crore. Due to the positive FPI equity flows from the middle of Mar2025 and various other factors, the investor sentiment in India turned positive, with stock indices gaining 12 to 15 per cent in the past three months or so.
In Jun2025 so far, FPI outflows are to the tune of Rs 5,400 crore.
Year-to-date (till 13Jun2025), FPI equity outflows are about Rs 98,000 crore.
If you take the data for the past five years, FPI equity inflows are a piffling Rs 1.67 lakh crore.
18-month data from Dec2023 to May2025 >
--------------------------------------------------------------
Update 13Jun2025: Charts 83 to 84:
Share of Major Currencies in Official Forex Reserves: Currency Share of Central Banks Forex Reserves (old blog dated 04Nov2023 Is De-Dollarization Real?) >
Over the years, there has been a decline in the share of US dollar, an international reserve currency, in the composition of official foreign exchange or forex reserves at the global level.
A country's forex reserves are held by Central Banks in various major currencies, like, the US dollar, Euro, Japanese Yen, Pound Sterling, Canadian dollar and Chinese Yuan.
The share of dollar decreased from 65.2 per cent in Jun2016 to 57.8 per cent as at the end of Dec2024, though it is still the predominant currency globally. During the period, the share of Euro slightly increased to 19.8 per cent; while the share of JPY increased to 5.8 per cent and CAD to 2.8 per cent. The data are from International Monetary Fund or IMF (COFER or Currency Composition of official foreign exchange reserves data).
Currency Share of Central Banks Forex Reserves data >
In
addition to currencies, global central banks also hold their forex
reserves in gold, as it is considered a safe haven asset during times of
volatility and heightened global uncertainty.
As per a recent report from ECB, gold has overtaken Euro as second reserve asset, after the US dollar. As of Dec2024, the share of currencies and gold in central bank forex reserves is as follows:
46% US dollar
20% gold
16% Euro
18% others
SDR Basket:
In Oct2016, the IMF added Chinese Yuan to its SDR or special drawing rights basket.
The
SDR is an international reserve asset.
The SDR is not a currency, but its value is based on a basket of five
currencies—the US dollar, the euro, the Chinese yuan, the Japanese yen and
the British pound sterling.
--------------------------------------------------------------
Update 01Jun2025: Charts 80 to 82:
RBI surplus transfer to Govt of India - (old blog dated 23May2024) >
For the financial year 2024-25, RBI transferred a record surplus of Rs 2.69 lakh crore to Govt of India, while maintaining the contingency risk buffer (CRB) at 7.5 per cent of its balance sheet size.
As the per the revised economic capital framework (ECF) announced on 23Mar2025, RBI has increased the contingency risk buffer (CRB) range to 4.50 - 7.50 per cent of the its balance sheet size from FY 2024-25 onwards. The CRB range for FY 2023-24 was 5.50 - 6.50 per cent of the balance sheet size.
Effectively, the lower bound decreased from 5.50 to 4.50 per cent and upper bound increased from 6.50 to 7.50 per cent from 2024-25 onwards.
The reduction in the lower bound of the Contingent Risk Buffer (CRB) range is noteworthy, as it theoretically allows the RBI in future years to retain a smaller portion of its surplus as reserves and transfer a larger share to the Government of India. This shift could further fuel concerns about the erosion of RBI's financial autonomy and resilience—a risk that former RBI Governor YV Reddy had cautioned against in 2019, referring to it as a potential 'raiding' of the central bank’s reserves.
In the exhibit below, you can compare columns 6 and 7:
whenever there is a rise in global bond yields and interest rates
(as represented by Fed funds rate), RBI's rate of earnings increases in
general as can be seen in years 2023-24, 2022-23 and 2018-19. (see blog on Fed Funds rate)
Chart below: RBI surplus transfer: Data from FY 2013-14 to 2024-25 relating to RBI surplus transfer, contingency risk buffer (7.5%), FCA level, FCA accretion / depletion during a year, Fed funds rate and RBI rate of earnings on its FCA, is presented in the chart below:
Column 7 in the following chart shows what return RBI earned on its FCA during a financial year. Though interest rates in the US declined between end-Mar2024 and end-Mar2025, there is an increase in RBI's rate of earnings during 2024-25.
The rate of earnings increased to 5.31 per cent in 2024-25 compared to 4.21 per cent in 2023-24. (see two screenshots from RBI annual report 2024-25 added below)
Partial explanation for the increase in rate of earnings for RBI for FY 2024-25:
1) Though accretion to forex currency assets (FCA) during 2024-25 is negative at USD 3.39 billion (column 5 in below chart), the average FCA during 2024-25 rose by 9.5 per cent or Rs 4.21 lakh crore to Rs 48.73 lakh crore (versus Rs 44.52 lakh crore average FCA during 2023-24). The increase in average FCA may have contributed to higher earnings on FCA.
FCA earnings in value terms showed a staggering 38 per cent growth from Rs 1.87 lakh crore in 2023-24 to Rs 2.59 lakh crore in 2024-25 -- effectively, FCA earnings increased by Rs 70,000 crore which enabled RBI to increase its surplus transfer to Rs 2.69 lakh crore in 2024-25 from Rs 2.11 lakh crore in the previous financial year.
It may be recalled India's forex reserves rose to a peak of USD 705 billion in Sep2024 before falling to USD 668 billion by the end of Mar2025 -- the rise in reserves during 2024-25 has obviously resulted in increase in average FCA during 2024-25.
2) But this does not fully explain the higher earnings because bond yields in the US were stagnant between between end-Mar2024 (US 10-year Treasury yield 4.21 per cent) and end-Mar2025 (4.21 per cent) -- though there was immense volatility in the bond yields during the period between end-Mar2024 and end-Mar2025.
In addition, the Fed reduced the federal funds rate by 100 basis points between Mar2024 and Mar2025. India's central bank, Reserve Bank of India or RBI, does not provide any reasons for increase or decrease on the return it generates on its FCA.
In the absence of any definitive information from RBI, one could surmise that asset managers of RBI's foreign currency assets may have utilised the higher volatility in bond prices to their advantage and earned higher returns for RBI's FCA.
3) In 2024-25, earnings from FCA in value terms increased by 38 per cent; but earnings from domestic sources in value terms decreased by 9.80 per cent to Rs 79,470 crore from Rs 88,100 crore in the previous year, as per RBI annual report.
Clarification on the above table:
Data
in columns 2,3 and 7 (surplus transfer, CRB and rate of earnings) are
as per RBI financial year (notes 3 and 4 in the table).
But data
in columns 4, 5 and 6 (FCA year-end, FCA accretion / depletion and Fed
funds rate) are as per Govt of India fiscal year that is, Apr-Mar for
all the years.
Two screenshots from RBI >
--------------------------------------------------------------
Update 01Jun2025: Charts 78 to 79:
RBI Rate of Earnings on FCA: Rate
of earnings generated by RBI on its foreign current assets, which are
part of its forex reserves: 26-year data from 1999-2000 to 2024-25
(related blog 08Mar2020 and another 10Nov2023):
RBI earned a return of 5.31 per cent on its foreign currency assets for the FY 2024-25, versus 4.21 per cent for FY 2023-24. This is the highest rate of earnings in the past 24 years.
Two charts showing the data >
--------------------------------------------------------------
Update 01Jun2025: Chart 77:
India current account deficit (CAD) : During FY 2024-25, India's CAD rose to 1.3 per cent of GDP or gross domestic product from 0.7 per cent of GDP in FY 2023-24, as per latest RBI Annual Report for FY 2024-25 released on 29May2025.
From
India's external vulnerability point of view, a current account deficit
of up to 2 per cent is considered as sustainable. Anything above 2 per
cent is likely to make India vulnerable to external shocks.
As
such, the CAD of 1.3 per cent of GDP in FY 2024-25 is not a worrying point. To support India's growth, the
country needs at least a minimum CAD of 2 per cent.
As
can be seen from data below, during 2011-12 and 2013-14, India
experienced high unsustainable CAD of more than 4 per cent which led to
forex crisis (severe weakness in rupee exchange rate) in 2011-12 and 2012-13.
16-year CAD data from 2009-10 to 2024-25 >
--------------------------------------------------------------
Update 05May2025: Charts 74 to 76:
RBI Gold Holdings and Forex Reserves as at the end of Mar2025: RBI
gold reserves are part of India's forex reserves maintained by RBI on
behalf of Government of India (for more on RBI gold holdings, see blog dated 07Mar2022).
Gold
holdings of Reserve Bank of India increased from 854.7 metric tonnes in Sep2024 to 879.6 metric tonnes in Mar2025, an increase of almost 3 per
cent in the past six months. The data are as per RBI's Half yearly report on management of foreign exchange reserves released today.
The
amount of gold holding (in US dollar terms) as a percentage of total
forex reserves of India is 11.7 per cent as of Mar2025; this is the
highest percentage of gold holdings in the past 16 years. In fact, for the first time, gold holdings in USD terms have surpassed 10 per cent of total forex reserves.
The previous high was 9.3 per cent as of Sep2024.
The value of RBI's gold holdings is USD 78.2 billion out of the total forex reserves of USD 668.3 billion as of Mar2025.
India gold reserves - physical gold as on 31Mar2025:
Of
the 879.6 metric tonnes of RBI gold reserves as of Mar2025, 512
metric tonnes is held in Indian vaults, 348.6 metric tonnes is held abroad
(in the safe custody of Bank of England and BIS or the Bank for
International Settlements), and 19 metric tonnes is held as gold
deposits.
India gold reserves - physical gold as on 31Mar2025:
As
the below chart shows, gold reserves held in India increased from 510.5
metric tonnes in Sep2024 to 512 metric tonnes in Mar2025 -- a small increase of just 1.5 metric tonnes in the past six months.
After the Russian invasion of Ukraine in Feb.2022 and subsequent economic sanctions on Russia and the illegal impounding of Russia's forex
reserves by the West, Government of India and Reserve Bank of India
seemed to have taken a conscious decision to bring back physical gold
reserves held abroad (with BoE and BIS) to Indian vaults.
As such, we are seeing increase in physical gold held domestically by RBI.
Total percentage of gold held by RBI domestically is now at 58.2 per cent of the total gold reserves -- this is close to the highest percentage in the past 15 years. As of Mar.2010, 52.4 per cent of the gold was held domestically.
Between Sep2024 and Mar2025, RBI bought 24.9 metric tonnes of gold; but the majority of gold bought in this period of six months is kept abroad in the safe custody of Bank of England and BIS.
As can be observed from the chart given below, RBI holding of physical gold held abroad increased from 324 metric tonnes as of Sep2024 to 348.6 metric tonnes as of Mar2025.
It may be recalled between Mar2022 and Sep2024, a total amount of 120.3 metric tonnes is brought
from abroad to India by RBI, as the below data show.
The behaviour of RBI between Sep2024 and Mar2025 (wrt bringing gold held abroad to Indian vaults) is significantly different from its behaviour between Mar2022 and Sep2024.
As mentioned above, RBI kept most of the gold bought between Sep2004 and Mar2025 held abroad with BoE / BIS.
This marks a sharp departure from the RBI's previous actions.
Interestingly, those jingoists who loudly celebrated the RBI's repatriation of physical gold from abroad (from the Bank of England and BIS) to Indian vaults are now conspicuously silent. 😆
--------------------------------------------------------------
Update 27Apr2025: Chart 73:
US Federal Funds Rate Cycles Since 1999 to Now : (old blog dated 25Feb2023):
The below chart shows the following:
> US Fed's Quantitative Easing (QE) and Tightening (QT) (for other charts, see Update 28Dec2024 with old charts 42 to 44)
The
current downward interest rate cycle in the US started in Sep2024 and
is continuing now; and it's expected to continue at least for another six to nine months, subject to incoming data. In the current down cycle, the
US Fed has decreased the Fed funds rate by 100 basis points so far.
However, Trump's tariffs have complicated the Federal Reserve's efforts to steer US PCE inflation back toward its long-term 2 per cent target. Growing speculation suggests the Fed may be compelled to cut the fed funds rate more aggressively than previously expected.
Adding to market chatter is the possibility that the Fed could halt its ongoing quantitative tightening (QT) and even pivot back to a new phase of quantitative easing (QE).
The large-scale and sweeping reciprocal tariffs announced by the Trump administration on 02Apr2025 are expected to create supply chain disruption leading to higher consumer prices in the US jeopardising Fed's efforts to tame inflation.
The
quantitative tightening cycle started in Apr2022 and is continuing now.
During the period, the US Fed's balance sheet size decreased from USD
8,965 billion to USD 6,725 billion, a decrease of more than USD 2,200
billion or 25 per cent decline.
However,
from the start of QE in Sep2008, the US Fed's balance sheet has grown
from USD 905 billion to USD 6,727 billion now -- an increase of 643 per
cent in almost 17 years.
--------------------------------------------------------------
Update 13Apr2025: Chart 72:
FPI Flows to India, changes in US dollar index (DXY) and US Treasury yields and their impact on BSE 200 index:
Large FPI outflows from Indian stock market depend on a number of factors:
This is a financial world where everything affects everything else.
- FPIs moving money out of India can't be attributed to a single factor; there could be a cluster of variables
- relative attractiveness of other financial markets, like, US bonds / stocks and stocks / bonds in China and Europe or commodities like gold or crypto currencies
- sometimes Indian stocks can be expensive, FPI may pull out money from India to invest in other jurisdictions
- Indian rupee depreciation / appreciation versus the US dollar too may impact FPI flows; dollar-rupee exchange rate in turn is influenced by the movements in US dollar index (DXY) and interest rate differentials between the two nations
-after the retirement of Shaktikantha Das as Reserve Bank of India governor, rupee fall has accelerated versus the US dollar
- between Nov2024 and now, financial markets are expecting policy measures, from Trump administration, that will be positive for US stocks (this is called Trump trade in market parlance)
- some of the FPI outflows from Indian stocks can be attributed to this
(In April 2025, the US stocks too sold off in a big way due to Trump reciprocal tariffs)
- at the end of Sep2024, Indian stocks appeared to be overvalued, this could be one of the reasons for massive FPI outflows
- even there are conerns about consumption slowdown in India leading to FPI outflows
-India's real GDP for Oct-Dec2024 quarter is much lower than expected
-the US Treasury bond yields have hardened since end of Sep2024; making US bonds more attractive for FPIs
- lack of public sector capex by PM Modi government since Apr2024 has affected market sentiment in India
- threat of Trump tariffs including reciprocal tariffs has damaged market sentiment towards risky assets in general
- yield spread between the US Treasuries and Indian government bonds and US-India interest rate differentials may influence the behaviour of FPIs towards Indian assets
Even though markets are impacted by a confluence of factors all the time, market pundits tend to focus only on one or two things that are current hot topics and build a narrative around those one or two factors.
As mentioned earlier, this is a world where everything is affected by everything else.
Are FPI equity inflows and outflows related to India impacted by changes in the US dollar index and US bond yields?
Several
money managers in India, especially during Jan-Mar2025 quarter, were of
the opinion that rising US Treasury yields and a strong dollar were
causing FPI outflows from the Indian stocks:
To assess whether
this claim bears any truth, I tried to examine the data of FPI flows, BSE 200 level, US bond
yields and the US dollar index (DXY or USDX is a measure of value of the
US dollar relative to six other major currencies, namely, Euro, Pound
sterling, Japanese Yen, Canadian dollar, Swedish Krona and Swiss Franc).
See the data presented below.
The data are for 22 quarters between Oct2019 and Mar2025. The data points are: quarterly net FPI flows to Indian stock market, quarter-end level of US 10-year Treasury yield, quarter-end dollar-rupee exchange rate, quarter-end BSE 200 level and its quarterly gain or loss. The data show a mixed picture.
Between the end of Dec2020 and Mar2021, the US 10-year Treasury yield rose from 0.92 to 1.75 per cent while the DXY rose from 89.9 to 93.2 -- this has not impacted the level of BSE 200 index in Jan-Mar2021 quarter, in which BSE 200 delivered a return of 6.5 per cent and FPI inflows were Rs 55,742 crore.
Let us consider another quarter, Jul-Sep2023, in which BSE 200 index rose by 4.1 per cent and FPI inflows were Rs 44,112 crore; while the DXY increased from 102.9 to 106.2 and the US 10-year bond yield surged from 3.8 per cent to 4.6 per cent.
Now, look at the data for Jan-Mar2022 in which there were FPI outflows to the tune of Rs 110,018 crore, but the BSE 200 barely moved. And in the same quarter, DXY rose from 95.7 to 98.4 and the 10-year bond yield rose from 1.51 to 2.35 per cent.
Apr-Jun2022 quarter: FPI outflows were Rs 107,340 crore and BSE 200 fell by 9.7 per cent -- here, FPI flows were negatively impacted by rise of DXY (moved sharply from 98.4 to 104.8) while the US 10-year Treasury yield spiked from 2.35 to 3.02 per cent.
Same is the case in Oct-Dec2024 quarter. As the DXY rose suddenly from 100.8 to 108.5 and 10-year yield rose from 3.77 to 4.57 per cent, the BSE 200 fell by 8.4 per cent with FPI outflows amounting to Rs 100,183 crore in the same period.
To sum up: For two quarters, Jan-Mar2021 and Jul-Sep2023, the rise of DXY and US 10-year yield had no negative impact (in fact, flows were positive and BSE 200 experienced positive returns) on FPI flows into Indian equities.
And for two quarters, Apr-Jun2022 and Oct-Dec2024 quarter, the sharp rise in DXY and US 10-year bond yield had coincided with the fall in BSE 200 levels and outflows by FPIs from Indian stock market.
As stated earlier, a variety of factors influence financial markets, including market sentiment and technological progress. It's disingenuous on the part of market experts to attribute market fall or rise to one or two variables.
There is no point in cherry picking data and build false narrative around market events.
Readers can observe these data points for other quarters and make their own conclusions. One thing is certain: In the past four to five years, foreign investors have not been enthused about investing in India. They have shown interest neither in FDI route (foreign direct investment) nor FPI route. In fact,
--------------------------------------------------------------
Update 13Apr2025: Charts 69 to 71:
FPI Flows to India : Foreign
Portfolio flows: 15-year data from 2010 to 2014
financial-year wise: FPI flows in both equity and debt segments (old blog 10Jul2022) >
The data include financial-year wise data, quarterly data and monthly data. The data are as per NSDL FPI monitor.
The
data include Sensex and BSE 200 levels as at the end of the respective
quarter / month -- which will enable the readers to discern the impact
of FPI outflows / inflows on the Indian stock market.
During FY 2024-25, FPI
flows to India in the equity segment are negative with outflows Rs 1.27 lakh crore; while debt flows are positive with Rs 1.47 lakh crore inflow in the same period -- the net FPI inflow being Rs 0.20 lakh crore.
The relentless selling of FPIs in the equity segment in the past six months (Oct2024 to Mar2025) has caused Indian stocks to fall significantly.
While the indices don't tell the full story of virtually a bear market in Indian stocks, the internals of the Nifty indices reveal a bleak picture of the stock market.
While the Nifty 50, Nifty Next 50 and Nifty Midsmallcap 400 fell by 10.5 per cent, 19.1 per cent and 16.5 per cent respectively from their 52-week highs; more than 18 per cent, 34 per cent and 54 per cent of the stocks respectively in these indices have lost more than 30 per cent of their values from their respective 52-week highs.
The
quarterly outflow of Rs 116,574 crore in Jan-Mar2025 quarter (versus Rs 100,183 crore outflow in Oct-Dec2024 quarter) is one of the
highest FPI outflows in Indian stock market in recent years.
Though
domestic institutional investors (DIIs) and retail investors have
remained as a counterweight to FPI outflows in the past eight years, the
exodus of FPIs in the past six months has a negative bearing on Indian stocks.
Till Sep2024, it was argued FPI inflows and outflows didn't matter for Indian markets as retail investors and mutual funds were continuously buying Indian stocks. But in the past six months, the narrative has changed -- no market pundit now talks about the irrelevance of FPI investors to Indian stock market.
Apr2025 data (till 11Apr2025): The frenzied selling of FPIs is continued in April also, with FPIs selling Rs 0.32 lakh crore in the equity segment. Surprisingly, they turned negative on the debt side also with selling of Rs 0.17 lakh crore so far this month.
Long-term data:
Let us see how FPI flows stack up on a long term basis. Total FPI flows (equity segment) in the past three-, five- and 10-year are positive at Rs 0.44 lakh crore, Rs 1.78 lakh crore and Rs 2.51 lakh crore respectively.
Total FPI flows (debt segment) in the past three-, five- and 10-year are positive at Rs 2.75 lakh crore, Rs 2.85 lakh crore and Rs 3.21 lakh crore respectively. Debt market has done much better than equity segment. However, it may be added these numbers are a pittance if you compare the size of FPI flows running into billions of dollars globally.
Comparison between Mar2020 (COVID-19 Pandemic Outbreak) and Oct2024-Mar2025 period:
FPI equity assets as at end-Feb2020 were Rs 28.87 lakh crore or USD 399.63 billion (USD INR 72.24 as 28Feb2020).
FPI equity outflows in Mar2020 were Rs 61,973 crore or USD 8.2 billion (USD INR 75.60 as on 31Mar2020).
So, FPI equity outflows in Mar2020 were 2.15 per cent of total FPI equity assets (FPI AUC) as at the end of Feb.2020.
FPI equity assets as at end-Sep2024 are Rs 77.87 lakh crore or USD 929.35 billion (USD INR 83.79 as 30Sep2024).
FPI equity outflows in Oct2024-Mar2025 period (six months) are Rs 216,757 crore (FPI NSDL data) or USD 25.3 billion.
So, FPI equity outflows in Oct2024-Mar2025 period are 2.78 per cent of total FPI equity assets (FPI AUC) as at the end of Sep2024.
So, the FPI selling in the last six months is much higher compared to their selling in COVID-19 period (one month data). The scale of FPI selling is staggering by any standards.
Three charts showing financial-year wise, quarterly and monthly data of FPI flows to India:
--------------------------------------------------------------
Update 13Apr2025: Charts 66 to 68:
FPI AUC data: FPI / FII AUC data: Assets under custody (AUC) data of foreign portfolio investors (FPIs):
(for old data > Old blog dated 10Jul2022 - Exit India Policy by Foreign Investors; and old blog dated 28Apr2022 - Foreigners' Shrinking Pie in Indian Equities)
FPI
equity assets, as on 31Mar2025, are Rs 66.79 lakh crore, showing an
annual growth (year-on-year) of 4.1 per cent in rupee terms. While in dollar terms they
are at USD 779 billion, with a yearly growth of 1.3 per cent.
In
the same period, BSE market cap rose by 6.7 per cent to Rs 412.88 lakh
crore, with Nifty 50 growing by 5.3 per cent and BSE 200 by 5.0 per
cent. The BSE market cap growth is slightly higher compared to rise of BSE 200, as there have been a number of new listings (initial public offers or IPOs) and follow on public offers (FPOs) in 2024.
Equity AUC assets held by FPIs are just 16.2 per cent of total market cap of all BSE listed firms as of 31Mar2025. The percentage of equity assets held by FPIs is slightly higher compared to 16.1 per cent as at the end of 31Dec2024.
FPI investors have been losing interest considerably in Indian stocks in the past four years -- their share has come down
from almost 20 per cent in Mar2021 to 16 per cent in Mar2025; domestic
investors' share has been rising gradually during the period.
Especially in the past six months (Oct2024 to Mar2025), FPI outflows from equity market has been more pronounced due to a variety of factors attributed often to -- high valuation of Indian stocks, growth tapering in India, relative attractiveness of assets in the US and China compared to India and others.
Total
assets (including equity and debt) in India held by FPIs are way
below USD 1 trillion achieved as of 30Sep2024.
The following charts provide data of equity AUC and debt AUC from Mar2017 till Mar2025.
During
FY 2024-25, the growth in equity AUC held by FPIs is much lower at 4.1 per cent (in rupee terms)
compared to the growth of 28.5 per cent in debt AUC -- this is due to huge
FPI inflows into debt segment in 2024 as India government bonds were included in JP Morgan and Bloomberg emerging market indices in Sep2023 and Mar2024 respectively.
--------------------------------------------------------------
Update 01Apr2025: Chart 65:
Global market data: Global market data pertaining to stocks, bonds,
commodities and currencies are presented here (old blog dated 29Jun2024).
Quarter-to-date
(QTD) global market data, as on 31st of March, 2025, of stocks, bonds,
currencies and commodities is as follows - QTD is same as year-to-date (YTD)
During Jan-Mar2025 quarter,
Indian large-cap indices, Dow Jones and Shanghai Composite were flat though they were volatile in between. Nikkei 225, Nasdaq Composite and BSE Midcap were the biggest losers in the quarter.
European stocks, in particular Germany stocks, have generally been stronger during the quarter due to optimism about military spending and some index stocks doing well -- this is in the backdrop of US stocks struggling.
Bond yields in the US and India are down; while the US - India 10-year bond yield spread widened by 19 basis points (100 basis points equal one percent) during the quarter.
Along with the US tech stocks (part of Nasdaq), Bitcoin suffered during the quarter with a drop of about 12% with huge volatility -- for the time being Bitcoin and US tech stocks seem to be moving in tango. Changes in global risk-on and risk-off sentiment are reflected both in Bitcoin (and other crypto currencies) as well as the US tech stocks.
The US dollar index (DXY or USDX) lost 4 per cent of its value with the US dollar losing versus pound sterling, Japanese Yen and Euro. Chinese Yuan and Indian Rupee are flat versus the USD.
The biggest stars, during the first quarter of 2025, are gold and silver, which are up by 18.6 and 16.5 per cent respectively. This is against the backdrop of heightened global uncertainty following Trump tariffs on Canada, Mexico, China and various countries and a variety of goods.
--------------------------------------------------------------
Update 30Mar2025: Charts 63 and 64:
Dollar-Rupee exchange rate: Financial year-wise and calendar year-wise data of the US dollar-Indian rupee exchange rate for the past 26 years (old blog dated 03Jun2024 on Why RBI Won't Favour a Strong Rupee and old blog dated 01Jun2024 on how to calculate currency depreciation and appreciation) >
USD-INR yearly gain / loss
Exchange rate yearly gain / loss
US dollar - Indian rupee yearly gain / loss
Exhibit 3: Financial year-wise: Dollar gain versus Rupee: Data include not only year-wise changes but
also 5-year change (annualised). For example, between end-Mar2020 and
end-Mar2025, the USD appreciated by 2.6 per cent annualised rate. And
between end-Mar2011 and end-Mar2016, the annualised USD appreciation vs
INR was much higher at 8.2 per cent.
For the past 25 years, USD has gained by an annualised 2.74 per cent versus INR.
Data range for FY-wise yearly change for the past 26 years is: minus 11.4 per cent to plus 27.5 per cent. The data range is so wide one can't even predict / forecast the yearly changes in USD-INR exchange rate.
Of the 26 financial years for which data are presented here, Govt of India and Reserve Bank of India allowed the rupee to appreciate against the dollar only on eight occasions.
Exhibit 4: Calendar year-wise: Dollar gain versus Rupee:
Data include not only year-wise changes but also 5-year change
(annualised). For example, between end-Dec2016 and end-Dec2021, the
annualised appreciation for USD vs INR is only 1.8 per cent; whereas
between end-Dec2007 and end-Dec2012, it was 6.8 per cent annualised.
For the past 25 years, the USD has appreciated versus INR at an annualised rate of 2.74 per cent.
Data range for CY-wise yearly change
for the past 26 years is: minus 1o.9 per cent to plus 22.9 per cent.
The data range is so wide one can't even predict / forecast the yearly
changes in USD-INR exchange rate.
Of
the 26 calendar years for which data are presented here, Govt of India
and Reserve Bank of India allowed the rupee to appreciate against the
dollar only on eight occasions.
--------------------------------------------------------------
Update 03Mar2025: Chart 62:
FPI Flows to India : Foreign
Portfolio flows: (old blog 10Jul2022) >
The data include monthly data. The data are as per NSDL FPI monitor.
The
data include Sensex and BSE 200 levels as at the end of the respective month -- which will enable the readers to discern the
impact of FPI outflows / inflows on the Indian stock market.
FPIs continue to sell Indian stocks heavily in the first two months of 2025, with total net outflows in these two months amounting to nearly Rs 1.13 lakh crore.
FPI net outflows for the past 3 months, 6 months and 12 months are Rs 0.97 lakh crore, 1.55 lakh crore and Rs 0.88 lakh crore respectively.
The total FPI outflows from the Indian equity market in the past five months (Oct2024-Feb2025) are Rs 2.13 lakh crore, which is the worst since FPIs entry into India in 1992.
The strong outflows have resulted in one of the worst drawdowns in India's stock market history.
--------------------------------------------------------------
Update 02Mar2025: Charts 60 and 61:
US Dollar Sale and Purchase by Reserve Bank of India: (old blog dated 05Aug2021 with monthly and yearly data for several years)
Two charts showing monthly and quarterly data of USD sales and purchases by RBI >
Between Oct2024 and Dec2024, RBI has been net seller in all the three months, with total sale amounting to USD 44.7 billion. Net sales in the past six months amount to USD 34.6 billion and for the past one year, net sales were USD 12.4 billion.
The Indian rupee, versus US dollar, has been under pressure in the past five months or so. The rupee depreciated, versus the USD, from 83.80 in Sep2024 to 87.40 now, showing a depreciation of more than 4 per cent.
Between end-Sep2024 and end-Dec2024, RBI net sold US dollars worth USD 44.7 billion in order to defend the exchange rate (India's central bank, RBI, publishes US dollar sale / purchase figures with a lag of two months).
Despite the strong defence of rupee by RBI through forex intervention, the rupee continued its sharp fall versus the dollar.
The heavy dollar sale has resulted in sharp depletion of India's forex reserves, showing a decrease of USD 65 billion in the past five months. Forex reserves are now USD 640 billion (they were USD 705 billion at the end of Sep2024).
A combination of global and domestic factors have negatively impacted rupee. Possible reasons for the sudden loss in rupee exchange rate are:
1) the US dollar has been appreciating versus major currencies due to a combination of tariffs imposed / threatened by newly-elected president Donald Trump on various countries, such as, Mexico, Canada and China
2) Foreign portfolio investors (FPIs) have resorted to unprecedented selling in the past five months -- with net FPI outflows of around Rs 2.10 lakh crore in the equity segment (they were net buyers in the debt segment with nearly Rs 20,000 crore)
3) Foreign investors seem to have found the US, China and other stock markets more attractive compared to Indian stocks. There were concerns about high market valuation of Indian stocks throughout the calendar year 2024 -- though the valuation concerns have dwindled in the Feb2025, with Nifty 50 and Sensex having lost around 14 per cent since the highs of Sep2024.
5) Indian economic growth rate has slumped in the Jul-Sep2024 and Oct-Dec2024 quarters
6) India's export growth has been weak recently
USD sales and purchase by RBI > monthly data from Dec2022 to Dec2024; and quarterly data from Oct2019 to Dec2024 >
--------------------------------------------------------------
Update 29Jan2025: Charts 58 to 59:
RBI USD-INR Forex Swaps: Details of RBI USD-INR Buy/Sell and Sell/Buy swaps (old blog dated 22Feb2022 and old Tweet thread dated 22Feb2022)
Reserve Bank of India on 27Jan2025 announced it would conduct a USD-INR buy/sell swap auction and the full details of which were announced on 28Jan2025. On 31Jan2025, RBI would conduct a buy/sell forex swap for USD 5 billion -- the stated purpose for the buy/sell swap is to inject liquidity into the banking system.
This is the not the first time a forex swap is conducted by RBI. It has been conducting them since Mar2019. And the current auction is seventh such one.
Central
banks the world over use forex swaps for a variety of reasons,
including liquidity management in their domestic markets.
India's
central bank, RBI, started using forex swaps as a liquidity management
tool, whereby it buys US dollar from banks giving rupee funds to banks
in exchange on the date when the swap was initiated. And on the maturity
date, RBI will sell US dollar to banks receiving rupee funds from banks
in return--thus completing the swap. For more details, see my earlier blog. The following two charts provide details of difference between a buy/sell and sell/buy forex swap and the seven forex swaps conducted by RBI between 2019 and now.
--------------------------------------------------------------
Update 16Jan2025: Charts 55 to 57:
FPI AUC data: FPI / FII AUC data: Assets under custody (AUC) data of foreign portfolio investors category-wise:
(for old data > Old blog dated 10Jul2022 - Exit India Policy by Foreign Investors; and old blog dated 28Apr2022 - Foreigners' Shrinking Pie in Indian Equities)
FPI
equity assets, as on 31Dec2024, are Rs 71.18 lakh crore, showing an
annual growth of 16.1 per cent in rupee terms. While in dollar terms they
are at USD 831 billion, with a yearly growth of 12.8 per cent.
In
the same period, BSE market cap rose by 21.3 per cent to Rs 441.95 lakh
crore, with Nifty 50 growing by 8.8 per cent and BSE 200 by 13.4 per
cent. The BSE market cap growth is much higher compared to rise of BSE 200, as there have been a number of new listings (initial public offers or IPOs) and follow on public offers (FPOs) in 2024.
Equity AUC assets held by FPIs are just 16.1 per cent of total market cap of all BSE listed firms as of 31Dec2024.
FPI investors have been losing interest considerably in Indian stocks in the past four years -- their share has come down from almost 20 per cent in Mar2021 to 16 per cent in Dec2024; domestic investors' share has been rising gradually during the period.
Total assets (including equity and debt) in India held by FPIs have slipped below USD 1 trillion during the Oct-Dec2024 quarter; they are a little above USD 900 billion as of 31Dec2024.
The following charts provide data of equity AUC and debt AUC from Mar2017 till Dec2024.
During 2024, the growth in equity AUC held by FPIs is much lower (FPI inflows to equity market are practically nil) at 16.1 per cent (in rupee terms) compared to the growth of 35 per cent in debt AUC -- this is due to huge FPI inflows into debt segment in 2024 as India government bonds were included in JP Morgan and Bloomberg emerging market indices in Sep2023 and Mar2024 respectively.
--------------------------------------------------------------
Update 14Jan2025: Charts 51 and 54:
FPI Flows to India : Foreign
Portfolio flows: 15-year data from 2010 to 2014 both calendar- and
financial-year wise: FPI flows in both equity and debt segments (old blog 10Jul2022) >
The data include financial-year wise data, quarterly data and monthly data. The data are as per NSDL FPI monitor.
The data include Sensex and BSE 200 levels as at the end of the respective quarter / month -- which will enable the readers to discern the impact of FPI outflows / inflows on the Indian stock market.
FPI
flows to India in the equity segment have been barely positive at Rs 427 crore in calendar year 2024; while debt flows are positive with Rs 1.65 lakh crore inflow in the same period.
The quarterly outflow of Rs 100,813 crore in Oct-Dec2024 is one of the highest FPI outflows in Indian stock market in recent years. Though domestic institutional investors (DIIs) and retail investors have remained as a counterweight to FPI outflows in the past eight years, the exodus of FPIs in the past three months has a negative bearing on Indian stocks.
As the FPI outflow of more than Rs 1 lakh crore in Oct-Dec2024 quarter is large in a short period of time, the Sensex lost 7.3 per cent of its value during the quarter.
Bond inclusion: One redeeming feature of FPI flows has been the positive inflow of Rs 1.65 lakh crore in the debt segment. After the announcement of JP Morgan including India government bonds in their EM indices in Sep2023 and the inclusion Indian government bonds in Bloomberg EM indices in Mar2024, FPI flows to Indian bond market have accelerated. Overall, this is a positive development for foreign portfolio flows to India.
--------------------------------------------------------------
Update 10Jan2025: Chart 50:
MSCI EM Index - China and India weights: Quarterly changes between Sep2024 and Dec2024: (for old data, see old blogs dated 07Jan2023 and blog 03Aug2021)
India's rank in the MSCI EM Index has slipped from second in Sep2024 to third rank in Dec2024. Taiwan regained second rank in Dec2024.
Taiwan's ranking has gone up due to rise in the stock price of semiconductor giant TSMC.
As
of Dec2024, India's weight is 19.43 per cent in third place; while
China maintains its first rank with 27.79 per cent weight. In the last three months, Saudi Arabia has gained fifth rank, for the first time, dethroning Brazil.
In Jul2024, India's weight
was above 20 per cent -- but as of Dec2024, its weight has slightly decreased;
as China's weight increased to 27.79 per cent from its recent low of
24.54 per cent (31Jul2024).
The chart below looks at the past five quarters data, with valuation ratios, top five countries and top five companies.
Four Indian companies are in the top 10 of the list.
--------------------------------------------------------------
Update 04Jan2025: Charts 47 to 49:
Global market data: Global market data pertaining to stocks, bonds,
commodities and currencies are presented here. The data points are yearly changes and compounded returns from 2013
to 2023, indicating how the values have moved over the years. (old blog dated 12Jan2024 - global market data 2013 to 2023).
The
stock market data presented in the table are price returns (not
including dividends) and they are in local currency terms.
Three charts here:
> Yearly changes from 2014 to 2024
> Compounded annual returns for 3-year, 5-y, 7-y and 10-y periods as at the end of 31Dec2024
You
can find out how the assets classes and currencies have moved over the
years. These charts reveal the cyclical nature of the returns in global
financial markets.
Over the past 12 calendar years, the movements of the US 10-year Treasury note yield and India’s 10-year G-Sec yield have shown significant divergence:
Simultaneous Increases: The yields for both countries rose together, albeit by differing amounts (in basis points), on four occasions: in 2013, 2018, 2021, and 2022.
Simultaneous Decreases: Similarly, both yields declined in tandem—though with different changes in basis points—on four occasions: in 2014, 2019, 2020, and 2023.
Divergent Movements: In four other years (2015, 2016, 2017, and 2024), the yield changes were divergent: when US yields rose, Indian yields fell, and vice versa.
This analysis suggests that the yields in the US and India do not always move in the same direction in any given year. The divergence is largely influenced by varying inflation differentials, interest rate policies, monetary strategies, and economic growth rates between the two countries, which often lead to distinct yield movements.
--------------------------------------------------------------
Update 01Jan2025: Charts 45 and 46:
Global market data: Global market data pertaining to stocks, bonds,
commodities and currencies are presented here (old blog dated 29Jun2024).
Quarter-to-date
(QTD) global market data, as on 31st of December, 2024, of stocks, bonds,
currencies and commodities is as follows - also included is year-to-data
(YTD) between Dec2023 and Dec2024:
During Oct-Dec2024 quarter, Indian stocks have been weak due to a variety of concerns (high valuation, weak consumption, FPI selling, regulation and others), while the Japanese, German and US stocks held well.
There is a big jump in US yields though the US Fed cut rates by 100 basis points. But Indian yields have remained the same during the quarter.
Bitcoin is the biggest gainer in the quarter (especially after Trump's victory in US presidential polls) with 47% rise. Silver is weak with 7% fall while gold held steady. Crude oil prices have increased by around 5%.
The US dollar index has recorded one of its biggest quarterly gains with 7.6% rise, with JPY, EUR and GBP losing heavily. Even the Chinese yuan is weak against the dollar.
In calendar year 2024, the biggest gainer is Bitcoin with a gain of more than 120%. Indian stocks are relatively subdued compared to US (led by Magnificent 7 and other tech stocks), German, Hong Kong and Japanese stocks. Mid- and small-cap stocks have done well for Indians. The US yields are up, while Indian bond yields are down.
YTD, gold and silver have given decent returns, while oil prices remained subdued. The DXY (US dollar index) rose by 7% as Japanese yen and GBP remained weak throughout the year.
(please click on the images to view better)
--------------------------------------------------------------
Update 28Dec2024: Charts 42 to 44:
US Federal Funds Rate Cycles Since 1999 to Now : (old blog dated 25Feb2023):
These three charts show the following:
> US Federal Funds Rate Cycles Since 1999 to Now
> US Fed's Four Interest Rate Hike Cycles Since 1999
> US Fed's Quantitative Easing (QE) and Tightening (QT)
The current downward interest rate cycle in the US started in Sep2024 and is continuing now; and it's expected to continue at least till the middle of 2025, subject to incoming data. In the current down cycle, the US Fed has decreased the Fed funds rate by 100 basis points so far.
There have be four interest rate hike cycles since 1999 till now.
The quantitative tightening cycle started in Apr2022 and is continuing now. During the period, the US Fed's balance sheet size decreased from USD 8,965 billion to USD 6,886 billion, a decrease of more than USD 2,000 billion or 23 per cent decline.
However, from the start of QE in Sep2008, the US Fed's balance sheet has grown from USD 905 billion to USD 6,886 billion now -- an increase of 660 per cent in 16 years.
--------------------------------------------------------------
Update 19Dec2024: Chart 41:
US Dollar Sale and Purchase by Reserve Bank of India: (old blog dated 05Aug2021 with monthly and yearly data for several years)
Between Mar2024 and Sep2024, RBI has alternated between selling US dollars in one month and purchasing them in the next, as part of its intervention in the foreign exchange market.
Net purchase of USD by RBI in FY 2024-25 amounts to USD 8.55 billion.
USD sales and purchase by RBI > data from Sep2022 to Sep2024 >
--------------------------------------------------------------
Update 19Dec2024: Charts 39 and 40:
US Federal Reserve Funds Rate: The US Federal Open Market Committee (FOMC) at its meeting on 18Dec2024 reduced federal funds rate by 25 basis points to a range
of 4.25-4.50 per cent.
The
rate increase cycle began in Mar2022 and the last hike was in Jul2023.
We can say the immediate past rate hike cycle lasted from Mar2022 till
Sep2024 -- a period of two years and a half.
Fed Funds rate from Dec2022 till now (for old data see charts below and see here) >
Calendar-year wise Fed Funds rate changes from 2003 to 2024 >
In calendar year 2024, the US Fed decreased the Fed funds rate by 100 basis points; whereas in 2023 and 2022, it was increased by 100 and 425 basis points respectively.
Interestingly, the current Fed funds rate is the same as it was at the end of 2022.
--------------------------------------------------------------
Update 10Nov2024: Chart 38:
FPI flows to India: Foreign Portfolio Investments (equity only): Monthly data of FPI equity flows till Oct2024:
Year to date (till Oct2024), FPI flows into Indian equity markets have been positive at Rs 6,593 crore.
But the month of Oct2024 has witnessed one of the heaviest selling by FPIs or foreign portfolio investors -- in this month, they sold Indian stocks worth Rs 94,000 crore. The relentless selling by FPIs continues in November 2024 (till 8th) also, with FPI selling amounting to Rs 20,000 crore.
Since the current bull market in Indian equity market since Apr2023, FPIs inflows into Indian stocks are Rs 2.04 lakh crore.
Comparison between Mar2020 (COVID-19 Pandemic Outbreak) and Oct2024:
FPI equity assets as at end-Feb2020 were Rs 28.87 lakh crore or USD 399.63 billion (USD INR 72.24 as 28Feb2020).
FPI equity outflows in Mar2020 were Rs 61,973 crore or USD 8.2 billion (USD INR 75.60 as on 31Mar2020).
So, FPI equity outflows in Mar2020 were 2.15 per cent of total FPI equity assets (FPI AUC) as at the end of Feb.2020.
FPI equity assets as at end-Sep2024 are Rs 77.87 lakh crore or USD 929.35 billion (USD INR 83.79 as 30Sep2024).
FPI equity outflows in Oct2024 are Rs 94,017 crore (FPI NSDL data) or USD 11.18 billion.
So, FPI equity outflows in Oct2024 are just 1.21 per cent of total FPI equity assets (FPI AUC) as at the end of Sep2024.
Due to huge selling of Indian stocks by FPIs in Oct2024, their FPI equity assets as on 31Oct2024 decreased to Rs 71.08 lakh crore (or USD 845.41 billion at USD-INR of 84.08), a fall of 8.72 per cent in the month of Oct2024 alone.
--------------------------------------------------------------
Update 10Nov2024: Chart 37:
US Federal Reserve Funds Rate: The US Federal Open Market Committee (FOMC) at its meeting
on 07Nov2024 reduced federal funds rate by 25 basis points to a range
of 4.50-4.75 per cent. This is a follow-up of the 50 basis points cut done by the Fed on 18Sep2024.
--------------------------------------------------------------
Update 29Oct2024: Charts 34 to 36:
RBI Gold Holdings and Forex Reserves as at the end of Sep2024: Gold holdings of Reserve Bank of India increased from 822.1 metric tonnes in Mar2024 to 854.7 metric tonnes in Sep2024, an increase of almost 4 per cent in the past six months. The data are as per RBI's Half yearly report on management of foreign exchange reserves released today.
The amount of gold holding (in US dollar terms) as a percentage of total forex reserves of India is 9.3 per cent as of Sep2024; this is the highest percentage of gold holdings in the past 15 years.
The previous high was 9.2 per cent as of Mar.2012.
The value of RBI's gold holdings is USD 65.7 billion out of the total forex reserves of USD 705.8 billion as of Sep2024.
India gold reserves - physical gold as on 30Sep2024:
Of the 854.7 metric tonnes of RBI gold reserves as of Sep2024, 510.5 metric tonnes is held in Indian vaults, 324 metric tonnes is held abroad (in the safe custody of Bank of England and BIS or the Bank for International Settlements), and 20.3 metric tonnes is held as gold deposits.
India gold reserves - physical gold as on 30Sep2024:
As the below chart shows, gold reserves held in India increased from 408.3 metric tonnes in Mar2024 to 510.5 metric tonnes in Sep2024.
The increase of 102.2 metric tonnes held in India is due to a combination of new gold bought in the period and gold brought to India from the physical vaults of Bank of England and the Bank for International Settlements (BIS).
After the Russian invasion of Ukraine in Feb.2022 and subsequent economic sanctions on Russia and the illegal impounding of Russia's forex reserves by the West, Government of India and Reserve Bank of India seemed to have taken a conscious decision to bring back physical gold reserves held abroad (with BoE and BIS) to Indian vaults.
As such, we are seeing increase in physical gold held domestically by RBI.
Total percentage of gold held by RBI domestically is now at 59.7 per cent of the total gold reserves -- this is the highest percentage in the past 15 years. As of Mar.2010, 52.4 per cent of the gold was held domestically.
Between Mar2024 and Sep2024, RBI brought an amount of 69.5 metric tonnes to Indian vaults from gold held abroad with BoE and BIS.
Between Mar2022 and Sep2024, a total amount of 120.3 metric tonnes is brought from abroad to India by RBI, as the below data show.
--------------------------------------------------------------
Update 19Oct2024: Charts 30 to 33:
MSCI EM Index - China and India weights: (for old data, see old blogs dated 07Jan2023 and blog 03Aug2021)
India's rank in the MSCI EM Index has risen in recent years, a manifestation of India's importance in the global world.
As of Sep2024, India's weight is 19.52 per cent with second place; while China maintains its first rank with 27.81 per cent weight. In the last one month, the gap between China and India weightings has widened due to sharp uptick in Chinese stocks last month. Taiwan closely follows India.
In Jul2024, India's weight was above 20 per cent -- but as of Sep2024, its weight has decreased; as China's weight increased to 27.81 per cent from its recent low of 24.54 per cent (31Jul2024).
The chart below looks at the past five quarters data, with valuation ratios, top five countries and top five companies.
As of Sep2024, top five companies in the index are TSMC, Tencent, Samsung, Alibaba and Meituan. Reliance Industries, HDFC Bank, ICICI Bank and Infosys are among the top ten from India stable.
Significantly, HDFC Bank regained its position among the top ten.
--------------------------------------------------------------
Update 18Oct2024: Charts 28 and 29:
FPI flows to India: Foreign Portfolio Investments (equity only): Monthly and quarterly data of FPI flows till Sep2024:
Year to date (till Sep2024), FPI flows into Indian equity markets have been positive at Rs 100,605 crore.
Since the current bull market in Indian equity market since Apr2023, FPIs inflows into Indian stocks are Rs 2.98 lakh crore.
However, in Oct2024 (till today), FPI equity outflows are Rs 77,701 crore as per NSDL FPI data.
Comparison between Mar2020 (COVID-19 Pandemic Outbreak) and Oct2024:
FPI equity assets as at end-Feb2020 were Rs 28.87 lakh crore or USD 399.63 billion (USD INR 72.24 as 28Feb2020).
FPI equity outflows in Mar2020 were Rs 61,973 crore or USD 8.2 billion (USD INR 75.60 as on 31Mar2020).
So, FPI equity outflows in Mar2020 were 2.15 per cent of total FPI equity assets (AUC) as at the end of Feb.2020.
FPI equity assets as at end-Sep2024 are Rs 77.87 lakh crore or USD 929.35 billion (USD INR 83.79 as 30Sep2024).
FPI equity outflows in Oct2024 (till today) are Rs 77,701 crore (FPI NSDL data) or USD 9.24 billion.
So, FPI equity outflows in Oct2024 (till today) are just 1 per cent of total FPI equity assets (AUC) as at the end of Sep2024.
Quarterly data: Since Jan2020, FPI equity inflows into Indian equity markets are Rs 3.46 lakh crore.
During Jul-Sep2024 quarterly, FPI inflows are Rs 97,405 crore, which is the highest in a quarter since Apr-Jun2023 quarter.
--------------------------------------------------------------
Update 01Oct2024: Charts 25 to 27:
FPI AUC data: FPI / FII AUC data: Assets under custody (AUC) data of foreign portfolio investors category-wise:
(for old data > Old blog dated 10Jul2022 - Exit India Policy by Foreign Investors; and old blog dated 28Apr2022 - Foreigners' Shrinking Pie in Indian Equities)
FPI equity assets, as on 30Sep2024, are Rs 77.87 lakh crore, showing an annual growth of 44 per cent in rupee terms. While in dollar terms they are at USD 930 billion, with a yearly growth of 42.6 per cent.
In the same period, BSE market cap rose by 48.7 per cent to Rs 474.35 lakh crore, with Nifty 50 growing by 31.4 per cent and BSE 200 by 38.5 per cent.
Equity AUC assets held by FPIs are just 16.4 per cent of total market cap of all BSE listed firms as of 30Sep2024.
Total assets (including equity and debt) in India held by FPIs have surpassed USD 1 trillion for the first time.
Between Mar2017 and Sep2024, equity assets held by FPIs have decreased from 19.5 per cent to 16.4 per cent of the total market capitalisation of all BSE listed firms. BSE Limited is one of the top two stock exchanges in India.
Chart given below shows yearly data from Mar2017, including USD INR exchange rate for comparison / contextual purposes.
Between Mar2017 and Sep2024, debt assets held by FPIs have increased from Rs 3.35 lakh crore to Rs 6.32 lakh crore.
Debt AUC data include data of debt VRR, debt FAR and hybrid; but does not include data of mutual funds and AIFs (alternative investment funds).
--------------------------------------------------------------
Update 01Oct2024: Charts 23 and 24:
Global market data: Global market data pertaining to stocks, bonds,
commodities and currencies are presented here (old blog dated 29Jun2024).
Quarter-to-date (QTD) global market data, as on 30 September 2024, of stocks, bonds, currencies and commodities is as follows - also included is year-to-data (YTD) between Dec2023 and Sep2024:
QTD: Among major stock indices, Hang Seng and Shanghai Composite indices have done well with China providing a fiscal and monetary stimulus in the last one week; while Nikkei 225 provided negative returns negatively impacted by steep rise in yen versus the dollar.
The US 10-year Treasury yield is down a staggering 62 basis points during the quarter based on expectations of Fed funds rate cut. Due to Fed rate cut expectations and actual cut by the Fed, US dollar index is down by 4.8 per cent; with JPY and EUR rising strongly against the dollar. Gold too has done well with achieving record-breaking highs during the quarter.
YTD: Hang Seng and S&P 500 have done well year to date. The US 10-year Treasury note yield is down by a mere 10 basis points. Gold and silver have been the biggest surprise winners of the year. Bitcoin has gained a massive 50 per cent during the year so far.
The US dollar index barely moved, though GBP gained 5.5 per cent against the dollar.
--------------------------------------------------------------
Update 19Sep2024: Chart 22:
US Federal Reserve Funds Rate: The US Federal Open Market Committee (FOMC) at its meeting on 18Sep2024 reduced federal funds rate by 50 basis points to a range of 4.75-5.00 per cent. This is the first rate cut since Mar2020.
The rate increase cycle began in Mar2022 and the last hike was in Jul2023. We can say the immediate past rate hike cycle lasted from Mar2022 till Sep2024 -- a period of two years and a half.
Fed Funds rate from Mar2020 till now (for old data, see here)
--------------------------------------------------------------
Update 05Sep2024: Chart 21:
FPI flows to India: Foreign Portfolio Investments (equity only): Monthly data of FPI flows till Jun2024 quarter and Aug2024 month:
Year to date, FPI flows into Indian equity markets have been positive at Rs 42,900 crore.
--------------------------------------------------------------
Update 02Aug2024: Charts 19 and 20:
FPI flows to India: Foreign Portfolio Investments (equity only): Quarterly and monthly data of FPI flows till Jun2024 quarter and Jul2024 month:
In the first seven months of 2024, FPI equity flows to India have been positive in four months and negative in three months -- with total FPI inflows from Jan2024 to Jul2024 amounting to Rs 35,600 crore.
In the past eight quarters (Jul2022-Jun2024), FPI equity flows have been positive in six quarters and negative in two quarters -- with total FPI inflows for those eight quarters amounting to Rs 2.70 lakh crore.
These monthly and quarterly charts will help you understand whether FPI equity inflows or outflows in a month have any relationship with the ups and downs of Indian equity markets.
A cursory glance at the data indicates the influence of FPIs has been slim to none on Indian stocks -- the markets are now dominated by inflows from domestic institutional investors (DIIs), high net worth individuals (HNIs) and retail investors.
(see Charts 10 and 11 added on 12Jun2024 for financial year-wise and calendar year-wise data)
--------------------------------------------------------------
Update 01Aug2024: Chart 18:
US Federal Reserve Funds Rate: The US Federal Open Market Committee (FOMC) at its meeting on 31Jul2024 decided to keep its federal funds rate unchanged at 5.25-5.50 per cent range (old blog dated 25Feb2023).
The US stock and bond markets reacted positively to the FOMC statement and post-policy press conference by Fed chair Jerome Powell. The comments are seen as dovish by the market.
The S&P 500 closed at 5,520, up 1.6 per cent yesterday while Nasdaq Composite was at 17,600, up 2.6 per cent.
The US 10-year Treasury yield closed at 4.06 per cent, while the 2-year closed at 4.29 per cent, both closed lower reacting positively to the FOMC / post-policy press conference.
Fed Funds rate from Mar2020 till now (for old data, see here)
--------------------------------------------------------------
Update 21Jul2024: Chart 17:
India's crude oil dependency: (blog dated 25Sep2023 with updates) India's
crude oil import dependency was 87.4 per cent during FY 2023-24, as per
latest data from PPAC, a Gov't of India body.
The ratio was much higher
compared to 77.6 per cent during FY 2013-14. Energy security is a neglected baby in India.
--------------------------------------------------------------
Update 24Jun2024: Chart 16:
Foreign Direct Investment flows : (old blog 25May2022) FDI Flows: A few months ago, net FDI to India in 2023-24 was reported as USD 10.6 billion -- but as per today's RBI data (the data here should be read in consonance with excel data in another RBI press release), it is only USD 9.8 billion, the lowest in more than a decade.
Net foreign direct investment (FDI) flows to India in FY 2023-24 were just USD 9.8 billion, the lowest in 17 years.
All data on gross FDI flows, FDI repatriated, FDI to India, FDI by India and Net FDI to India >
--------------------------------------------------------------
Update 24Jun2024: Chart 15:
India current account deficit (CAD) : During FY 2023-24, India's CAD fell sharply to 0.7 per cent of GDP from 2 per cent GDP in FY 2022-23, as per latest RBI data on Balance of Payments (BoP). (old blog 10Nov2023)
From India's external vulnerability point of view, a current account deficit of up to 2 per cent is considered as sustainable. Anything above 2 per cent is likely to make India vulnerable to external shocks.
As such, the CAD of 0.7 per cent of GDP in FY 2023-24 is too low from India's economic growth perspective. To support India's growth, the country needs at least a minimum CAD of 2 per cent.
As can be seen from data below, during 2011-12 and 2013-14, India experienced high unsustainable CAD of more than 4 per cent which led to forex crisis (severe weakness in rupee exchange rate) in 2011-12 and 2012-13.
During 2020-21, India experienced, on an annual basis, current account surplus (0.9 per cent) for the first time since 2003-04. Due to draconian lockdowns following COVID-19 Pandemic, India suffered severe contraction (minus 5.8 per cent real GDP growth) in economic growth in 2020-21. And this led to huge fall in imports relative to exports -- ultimately resulting in current account surplus for the year.
15-year CAD data from 2009-10 to 2023-24 >
--------------------------------------------------------------
Update 20Jun2024:
RBI Gold Holdings : What RBI governor Shaktikanta Das said during ET NOW Leadership Dialogues 2024 (video of 18Jun2024) on RBI bulking up on gold reserves (part of RBI forex reserves):
"We want to diversify the deployment of our forex reserves in more currencies and in different kind of assets, particularly gold. (portfolio diversification of India's forex reserves)
"Gold prices, in the long term, generally go up. So, gold is considered as a kind of permanent hedge against exterrnal uncertainities and challenges. We naturally buy gold whenever there is an opportune moment.
"Yes, building up gold reserves is a part of our reserve deployment and we will continue with that depending on the international prices."
--------------------------------------------------------------
Update 20Jun2024:
RBI Gold Holdings : RBI Excerpts from the post-Monetary Policy press conference on 07Jun2024 (source: RBI's transcipt - video of the press conference):
Swati Bhat of Reuters asks:
"I just wanted to understand if there is a change in policy and is it because of the geopolitical tensions (and decognition of Russian reserves) that we are trying to keep more gold within India now?"
RBI governor Shaktikanta Das answers:
"You see, with regard to the movement of the gold. In fact, I am quite surprised that it is appearing in the media so late. We release half-yearly data of our gold reserves and that clearly says how much is held in India and how much is held outside India. I was expecting the media to pick up the end-September 2023 data. Nobody picked it up and we were really surprised. I was expecting the end-March 2024 data also to be picked up by the media and nobody noticed it. Basically, the quantum of gold held by the RBI outside the country was static for a long time. But in the recent years, the data shows that the Reserve Bank has been buying gold as a part of its reserves management, and the quantum held outside was going up. We have domestic capacity now, and we felt part of the gold should be stored within the country. That is it. Nothing more should be read into it."
--------------------------------------------------------------
Update 15Jun2024: Chart 14:
RBI Gold Holdings : RBI gold reserves are part of India's forex reserves maintained by RBI on behalf of Government of India (for more on RBI gold holdings, see blog dated 07Mar2022).
RBI bought 200 metric tonnes of gold from International Monetary Fund (IMF) during October 19-30, 2009.
After buying gold from IMF, RBI kept quiet for eight years. It started buying physical gold again at the end of 2017.
Between 2017 and now, RBI has accumulated additional gold amounting to 270 metric tonnes. As of 26Apr2024, RBI holds 827.7 metric tonnes of gold.
Gold held abroad:
Since 1991, RBI has been holding 65.49 tonnes of gold abroad; the
amount was constant till Oct2009, when RBI bought 200 tonnes of gold
from IMF. Then, the quantity of gold held abroad (kept with Bank of England and Bank for International Settlements) increased to 265.49
tonnes including gold bought from IMF.
As the below chart reveals, gold held abroad increased from 265.49 tonnes in Mar2010 to 453.52 tonnes in Mar2022, which was the peak for gold kept abroad and later gold held abroad started coming down.
So, what caused the change of heart in RBI to bring back gold from abroad to India? What happened in Mar2022?
Between Mar2022 and Mar2024, RBI gold holdings rose from 760.4 tonnes to 822.1 tonnes. In the same period, gold held in India rose from 295.8 tonnes to 408.3
tonnes; while gold held abroad declined from 453.5 tonnes to 387.3
tonnes -- clearly indicating RBI brought back, at least 50 tonnes, gold
from foreign vaults (kept with Bank of England and Bank for International Settlements) to Indian vaults.
Possible reasons for RBI shifting physical gold from abroad to India are discussed in this blog (see updates 25May2024 and 10Nov2023 in this blog).
The following chart further reveals the following:
> the percentage of physical gold held in India rose from 38.9 per cent in Mar2022 to 49.7 per cent in Mar2024
> it may be added the percentage of physical gold held in Mar1995 was as high as 83.5 per cent -- over the years, the percentage of gold held in India declined till Mar2022
(Note: RBI gold holdings in 1998-99 declined due to redemption of Gold Bonds scheme - source: page 133 of RBI Annual Report 1998-99)
Details of RBI's physical gold holdings are available from three RBI sources:
1). RBI annual reports (data as at end of March every year)
2). RBI Half-Yearly Report on Foreign Exchange Reserves (data as at end-March and end-September every year) -- this report contains more comprehensive data on RBI gold reserves
3). RBI Monthly Bulletin (data at weekly intervals, but available only in RBI Bulletins released every month). It may be added RBI was not revealing volume data of physical gold in its monthly RBI Bulletins prior to 2021; but started revealing volume data only since Jan2021 (with weekly volume data from 20Nov2020 onwards).
--------------------------------------------------------------
Update 15Jun2024: Charts 12 to 13:
RBI Gold Holdings : RBI
--------------------------------------------------------------
Update 12Jun2024: Charts 10 and 11:
FPI Flows to India : Foreign Portfolio flows: 15-year data from 2010 to 2014 both calendar- and financial-year wise: FPI flows in both equity and debt segments (old blog 10Jul2022) >
FPI flows to India in equity segment have been negative to an extent of nearly Rs 30,000 crore in CY 2024; while debt flows are positive with Rs 75,000 crore in the same period.
--------------------------------------------------------------
Update 10Jun2024: Chart 9:
RBI Rate of Earnings on FCA: Rate of earnings generated by RBI on its foreign current assets, which are part of its forex reserves: 25-year data from 1999-2000 to 2023-24 (related blog 08Mar2020 and another 10Nov2023):


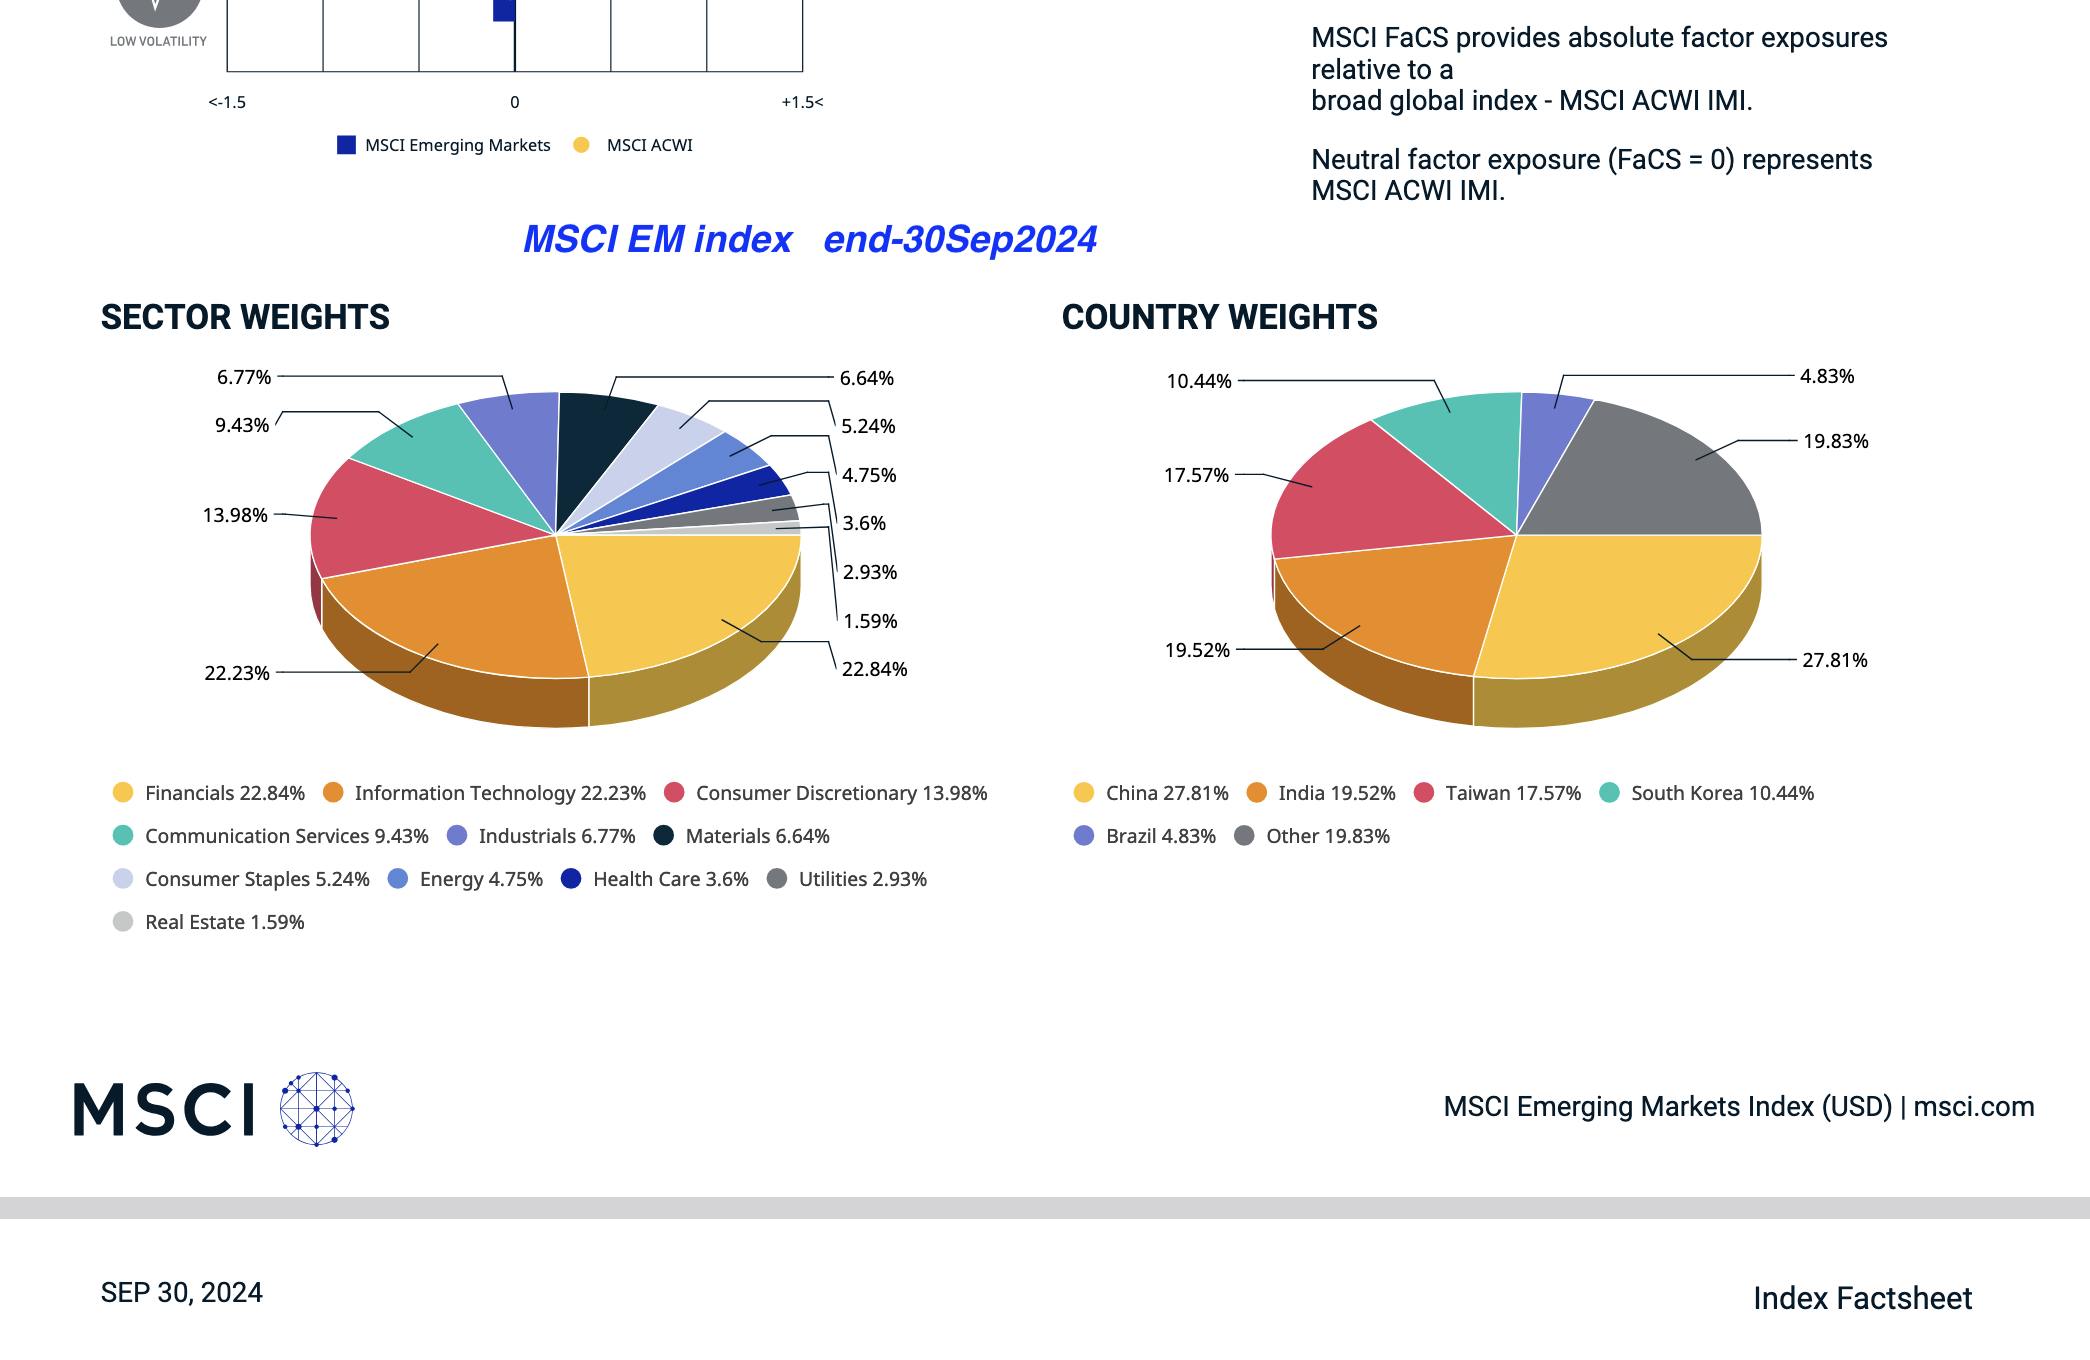


No comments:
Post a Comment