--------------------------------------------------------------
Update 16Jul2026: Chart 146:
AMFI List: Classification of Indian stocks by market capitalisation: To be followed by Equity Mutual Funds or EMFs (previous blog dated 17Feb2024 / Tweet thread 05Jan2023)
SEBI's Oct2017 definition of stocks on the basis of their market capitalisation is as follows:
1) large-cap stocks: 1st to 100th company in terms of full market capitalisation
2) mid-cap stocks: 101st to 250th company in terms of full market capitalisation
3) small-cap stocks: 251st company onwards in terms of full market capitalisation
According to SEBI definition, Association of Mutual Funds in India (AMFI) prepares a list of all listed stocks (more than 5,000 in number) based on their average market capitalisation and publishes the list of large-, mid- and small-cap stocks.
AMFI prepares the list two times in a year, that is, at the end of June and December of every year.
The below chart provides data as published by AMFI for the half-yearly period (based on average market capitalization of stocks during Jan-Jun2026) ended 30Jun2026.
As on 30Jun2026:
Large-cap stocks: Stocks with market cap of more than Rs 106,000 crore
Mid-cap stocks: Stocks with market cap of more than Rs 33,500 crore, but less than Rs 106,000 crore
Small-cap stocks: All stocks with market cap of less than Rs 33,500 crore
Percentage change in market cap is modest in the past one year.
Changes in market cap in the past one year:
16.5% large-cap
9.8% mid-cap
But market cap expansions are more than 90 per cent in the past three years.
Absolute changes in market cap in the past three years:
114% large-cap
93% mid-cap
This means, a stock with more than Rs 17,400 crore, but less than Rs 49,600 crore market cap was considered a mid-cap stock three years ago; but now the market cap range for a mid-cap stock has more than doubled to Rs 33,500-106,000 crore -- as Indian stocks provided stellar returns in the past three years.
Chart: Snapshot of AMFI classification of stocks by market cap: Data from Dec2022 to Dec2025:
Chart 146 click on the image to view better >
--------------------------------------------------------------
Update 06Jul2026: Charts 143 to 145:
Related blog dated 15Nov2023 and India falling behind Bangladesh).
See Update 30Oct2025 below with Charts 82 to 84, and
Update 04Jul2024 below with Charts 5 to 7 in the same blog for more explanation of the terms used here.
India GNI per capita as per World Bank : India's
per capita national income (or simply India per capita income), in current US dollars, grew by a robust 8.2 per cent
in 2025 to 2,760, as per latest data (updated 01Jul2026) from the World Bank.
India's
rank as per capita GNI in current US dollars (Atlas method) is 138 in
the world, among the 181 countries for which data are available.
Gross national
income (GNI) is the total income earned by a nation’s residents and businesses irrespective of where it is
earned. It can be calculated by adding income from foreign countries to country’s
gross domestic product (GDP).
Per
capita income is often considered as an indicator of a nation's economic
health (Adam Smith himself said so 250 years ago!) and standard of living.
Spectcular growth from 2003 to 2011:
As can be observed from the chart below, the period from 2003 to 2011 has
seen the biggest surge in India's per capita income in dollars. And during the period, India happened to be ruled by AB Vajpayee and Dr Manmohan Singh.
This is another way of saying Thiru PM Modi government has done a poor job in lifting per capita income of Indians.
In the past 25 years, India's
per capital national income in US dollars grew by an annualised rate of
7.62 per cent.
Comparison with comparable countries: Comparable
countries, like, BRICS, G20 and others are included in the chart below
to see how
India performs relatively. As per World Bank’s 2025 data as of Jul2026 about per
capita GNI, India is still a lower middle income country.
Note the World Bank has revised India's recent history downwards: 2024 is now USD 2,550 (was 2,650), 2023 is USD 2,490 (was 2,580), 2022 is USD 2,360 (was 2,390). Earlier years are not revised.
India's rank at 138 is below that of comparables like, Bangladesh, Egypt, Sri Lanka and Vietnam. India’s
rank in per capita income is the lowest not only among the
G20 nations, but also among BRICS countries.
It's too unfortunate India's rank is in fourth quartile. India at 138 of 181 puts it in the bottom quarter of the world by per capita income, even as it stands as the sixth largest economy in aggregate size.
That contrast, scale versus per person, is the single most misunderstood fact about India's economy and the table below shows it plainly.
Caveat: India's per capita GNI rank (138 of 181) in World Bank data reflects nominal Atlas-method income. Purchasing power parity (PPP-adjusted) measures are often more relevant for comparing purchasing power (living costs) and living standards across countries.
Vietnam and Sri Lanka upgraded to Upper Middle Income
A most significant aspect of Jul2026 World Bank data is both Vietnam and Sri Lanka moved from lower middle to upper middle income country ranks. The Philippines (USD 4,850), Jordan (USD 5,260), and Micronesia (USD 4,760) were also part of this upper-middle graduating class as on 01Jul2026.
The World average is USD 14,244.
World Bank Country Classification: World Bank
divides countries into four groups by their income level.
The groups
are:
low income,
lower middle income,
upper middle income and
high income.The thresholds for
country classification, as on 01Jul2026 for FY 2027, are given in the
below chart. The levels are as per Atlas GNI per capita in current US
dollars (2025 data).
As per 2025 World Bank data, India's population is 146.39 crore or 1.46 billion.
Big Slowdown in India Per Capita GNI annualised growth rates >
7.62% past 25-year CAGR (2000 to 2025)
7.10% 20-y CAGR
5.65% 15-y CAGR
5.74% 10-y CAGR7.75% 5-y CAGR (from low base of COVID-19 year)
5.36% 3- y CAGR
There has been a marked slowdown in per capita income (in US dollars) during Thiru PM Modi's government.
Data Sources:
Tweet 06Jul2026 Prediction Vietnam to upgrade to upper middle income country became true
Tweet 22Jan2025 India at bottom of G20 nations
Tweet 06Jul2019 Adam Smith on per capita income
World Bank per capita GNI, Atlas Method (current US dollars)
World Bank per capita by PPP (current international dollar)
World Bank Country classification by income group
Charts 143 to 145 Click on them to view better >
--------------------------------------------------------------
Update 12Jun2026: Chart 142:
India - Currency in Circulation (CIC): Analysis of currency in circulation data over the years: Cash versus Digital Payment methods - refer blog "Indians' Love for Cash Continues Unabated" dated 12Jul2022 - Currency to GDP ratio - CIC-GDP ratio -
This updates the earlier Update 05Jun2026 with Chart 136.
As nominal GDP under new GDP series (with base year 2022-23) has decreased compared to data under old GDP series (with base year 2011-12), the currency to GDP ratio has increased by up to 0.3 percentage points across the past four years, for which data are made available by MoSPI, Govt of India.
Check the chart below.
Data sources: RBI DBIE, MoSPI and author
Tweet thread - Indian Economy Data Bank
Chart 142 showing India currency to GDP ratio (based on GDP New Series with base year 2022-23) >
--------------------------------------------------------------
Update 07Jun2026: Chart 141:
India GDP New Series (base year 2022-23) >
India GDP quarterly growth rates: Real GDP and Nominal GDP Growth Rates %: Data for 16 quarters from Apr-Jun2022 to Jan-Mar2026 Quarter:
India's Real GDP growth in the latest four quarters has remained remarkably resilient, hovering in a narrow range (6.8-8.3%) and strengthening after a softer start to FY 2025-26 (the real GDP growth for the full year is 7.7 per cent).
The sustained pace of growth suggests that economic activity remains robust even as nominal GDP growth and the implied GDP deflator have moderated.
Nominal GDP growth has exhibited a clear downward trend, falling from double-digit levels in FY 2023-24 to around 9 per cent in recent quarters.
In nominal terms, Indian economy is stuck at quarterly growth rate of nearly 10 per cent (range 8.6-11.5%) in the past three years.
Real GDP growth, meanwhile, has remained relatively stable, suggesting that the moderation in nominal growth is being driven more by prices than by output.
The narrowing gap between nominal and real growth points to a steadily declining GDP deflator.
This trend is noteworthy because it persists despite evidence of price pressures across several sectors of the economy.
As a result, the official data portray an economy with stable real growth but increasingly subdued economy-wide inflation.
Economists such as Pronab Sen and Arvind Subramanian have expressed concerns about India’s GDP deflator, arguing that it is “too smooth” and may understate actual price pressures, which can overstate real GDP growth.
Taken together, the data suggest that interpretation of recent growth performance depends critically on the reliability of the deflator used to convert real GDP into nominal GDP.
Data sources:
MoSPI press note 05Jun2026 with latest GDP estimates
Tweet 06Jun2026 - why is it called GDP Deflator, instead of GDP Inflator?
Chart 141 showing data for 16 quarters from Apr-Jun2022 to Jan-Mar2026 Quarter >
--------------------------------------------------------------
Update 06Jun2026: Charts 138 to 140:
India GDP New Series (base year 2022-23) >
Complement this data with:
Blog 1: From Farms to Factories to Services: India’s GDP Explained via Production Approach 22Feb2026
Blog 2: Understanding India’s GDP – A Simple Guide to the Expenditure Approach 18Feb2026
Tweet thread
28Feb2026 - India GDP New Series (base year 2022-23) - methodology
changes - ACNAS - background - key points of GDP revisions - Pronab Sen
interview
Tweet thread 28Feb2026 - India GDP New Series (base year 2022-23) - GDP / GVA for recent years and GDP growth rates
Update 28Feb2026: Charts 112 and 113 with New Series data (in the same blog) -- the Update explains the Key changes in methodology and other between the Old and New Series data
India GDP estimates have been revised by MoSPI following the adoption of the new National Accounts Series (Base Year 2022–23). Revisions reflect updated methodology, data sources and benchmark estimates.
Accordinlgy, MoSPI released GDP estimates under the new series (Base Year 2022–23) on 05Jun2026; the charts below compare these estimates with those under the old series.
Chart 1 below reveals:
In FY 2025-26, India's economy is estimated to have grown by 7.7 per cent in real terms and 8.9 per cent in nominal terms, according to Govt of India data.
Real GDP in 2025-26 grew from Rs 300 lakh crore in 2024-25 to Rs 323 lakh crore. During the same period, nominal GDP increased from Rs 318 lakh crore to Rs 346 lakh crore, showing a growth of 8.9 per cent.
Over FY 2022-23 to FY 2025-26, the new GDP series shows a steady expansion of the economy, with real GDP growth hovering in a range of 7.1 per cent to 7.7 per cent.
In the same period, the nominal GDP showed a declining trend, with growth rate dropping from 11 per cent in 2023-24 to 8.9 per cent 2025-26.
It may be mentioned New Series data prior to FY 2022-23 have not yet been released by MoSPI.
Note: In the base year (FY 2022-23), nominal GDP and real GDP are equal (Rs 261.18 lakh crore) because both are measured using FY 2022-23 prices.
Differences emerge in subsequent years as nominal GDP reflects current prices while real GDP is measured at constant prices, with base-year of 2022-23).
Chart 2 below reveals:
Real GDP comparison chart shows a fairly clear pattern in how India’s growth is being re-estimated under the new series.
Real GDP growth is broadly stable in the latest two years (FY 2024-25 and FY 2025-26), with only small upward revisions compared to the old series (under the New Series, the growth rate in 2025–26 was 0.3 percentage points higher than in the Old Series, compared to a 0.6 percentage point increase in 2024–25).
However, FY 2023-24 stands out, where growth is revised down sharply by about 2 percentage points.
Overall, the chart suggests that India’s underlying growth momentum remains strong, according to government's official estimates.
Why the 2023-24 real GDP growth rate under new series revised down so sharply?
Some plausible reasons:
The sharp 2.0 percentage point drop in FY 2023-24 growth (from 9.2% to 7.2%) reflects a major rebasing of India’s GDP series rather than a change in underlying economic momentum.
With FY 2022-23 as the new base year, the economy is now measured using updated data sources, revised sector weights and improved methods of estimating real activity.
The biggest impact of this methodological shift is concentrated in FY 2023-24, which effectively acts as the first full “post-rebasing” year.
By contrast, FY 2024-25 and FY 2025-26 show much smaller differences between the old and new series.
This suggests that once the revised GDP system is taken care of in FY 2023-24, both series begin to track a similar underlying growth path, with no further major adjustments required.
In simple terms, FY 2023-24 absorbs the bulk of the “measurement reset,” while later years reflect a more stable growth paths, with no major differences in growth rates.
Chart 3 below reveals:
The Nominal GDP comparison chart shows that India’s nominal GDP is slightly lower under the new series compared to the old series, indicating a modest downward adjustment in the estimated size of the economy.
Over 2022-23 to 2025-26, the differences in nominal GDP level are in the range of minus 2.9 per cent and minus 3.8 per cent.
In terms of nominal GDP growth rates, the differences between the old and new series are small and show a mixed picture. A few years show slightly higher growth rates, while others show slightly lower growth.
Overall, this suggests that the revisions do not materially change the broad nominal growth trend over the period.
So, what are the reasons for lower GDP levels under new series?
Possible reasons for the decline in Nominal GDP levels:
It may seem surprising that India’s new GDP series has reduced the size of the economy by about 3–4 percentage points instead of increasing it, which is often expected after a base-year update.
This is due to methodological changes rather than a loss of output. Economists such as Arvind Subramanian and Pronab Sen had earlier expressed scepticism that the old 2011–12 GDP series might have been overstating growth due to limitations in informal sector estimation and the use of proxy-based assumptions.
The new methodology addresses several of these concerns by improving corporate sector measurement, reducing aggregation overlaps and incorporating more direct survey-based data for the informal economy.
Together, these changes may have resulted in a slightly lower—estimate of nominal GDP.
Data sources:
MoSPI press note 05Jun2026 with latest GDP estimates
Tweet 06Jun2026 - why is it called GDP Deflator, instead of GDP Inflator?
(if you want to see historical Old Series Nominal GDP data, please check Update 06Jun2026 with Chart 137 in the same blog)
(likewise, if you want to check historial Old Series Real GDP data, please check Update 30Jun2025 with Chart 56 in the same blog)
Three Charts:
> India Annual GDP Growth Rates - Real and Nominal GDP New Series (Base Year 2022-23)
> Real GDP Comparison (Old vs New Series)
> Nominal GDP Comparison (Old vs New Series)
--------------------------------------------------------------
Update 06Jun2026: Chart 137:
India GDP Old Series (base year 2011-12) > India Nominal GDP >
Complement this data with:
Update 02Dec2025 with Chart 91: old series
Update 29Aug2025 with Chart 70: old series
Update 07Jul2025 with Chart 59: old series
India GDP yearly growth rates: Nominal GDP Growth Rates %: Data from 1998-99 to 2025-26:
The data presented in Chart 137 are based on Old Series with base year 2011-12. It may be mentioned India has since adopted a New Series with base year 2022-23, effective from the financial year 2025-26.
Accordingly, the data shown in Chart 137 are provided for record purposes only.
Chart 137 showing Old Series (base year 2011-12), Nominal GDP growth rates >
--------------------------------------------------------------
Update 05Jun2026: Chart 136:
India - Currency in Circulation (CIC): Analysis of currency in circulation data over the years: Cash versus Digital Payment methods - refer blog "Indians' Love for Cash Continues Unabated" dated 12Jul2022
The chart below shows data on India's currency in circulation, its growth over the past 14 years from 2011-12 to 2025-26, stacked against nominal GDP growth and CPI inflation numbers.
What does the chart below reveal?
India's currency in circulation (CIC) and nominal GDP have moved closely over long periods. Over 14 years, CIC grew about 290 per cent and GDP about 309 per cent. The gap between the two growth rates is small.
Currency in circulation is a sum of Bank notes, Rupee coins and Small coins.
Over the past 10 years, CIC rose about 150 per cent and nominal GDP about 159 per cent. The two move almost together.
Over 6 years (FY 2019-20 to FY 2025-26), CIC grew about 70 per cent and nominal GDP about 78 per cent. This removes the Covid year distortion.
The 5-year gap between growth rates of CIC and GDP is large; hence the 5-year window is not very useful here. It starts from the Covid-19 Pandemic year (2020-21). That year had unusual cash hoarding and fall in economic growth, so the comparison can mislead.
Over 3 years, CIC rose about 23 per cent while GDP rose about 33 per cent. GDP has grown faster in the recent period.
Across 6, 10 and 14 year periods, CIC and GDP growth stay fairly close. There is no widening gap over time.
The currency-to-GDP ratio has stayed around 11 to 13 per cent for most of the past 14 years, except in 2020-21 (Covid-19) and 2016-17 (demonetisation).
Demonetisation caused a sharp fall in cash, pushing the CIC share in nominal GDP to 8.7 per cent, the lowest in our observed period. But the following year, cash holdings rebounded quickly with cash-GDP ratio climbing to 10.7 per cent and by 2019-20 normalising to 12.2 per cent.
Covid-19 caused the opposite, with a sudden rise in cash holding and contraction in GDP, with cash to GDP ratio rising to 14.4 per cent, the highest in our observed period.
Even with rapid growth in digital payments, Indians' proclivity to hold cash continues. Given the degree of trust we have in our governments and institutions, the fondness for cash won't go away in a hurry for decades. 😀
As noted in the RBI Annual Report 2025–26, RBI conducted its own survey on households' payment behaviour. According to the survey, Indians continue to show "strong preference for usage of cash."
The share of Rs 500 banknote denomination, in value terms, is 85 per cent as of Mar2026.
This corroborates that cash usage remains strong despite the rapid growth of digital payments.
Overall, cash demand in India has broadly kept pace with the size of the economy over the long run. The currency to GDP ratio is stable around 12 per cent for most of the years.
Important notes on cash versus digital payments:
Digital payment methods make spending easier, which can lead people to spend more than they do with cash.
Although most users prefer digital payments for convenience, many still believe cash offers better budget control.
The shift toward digital payments is widely viewed as permanent, with cash usage expected to decline significantly.
Cashback, discounts and rewards strongly encourage consumers to choose digital payment methods.
For many users, the security of digital transactions is still a major concern.
One day India might move toward a less-cash society (though it may be years away). At the same time, there is a need for providing digital budgeting and spending-monitoring tools for financial discipline.
The role of cash as a store of value is persistent in India and across many other countries.
Lived experiences of Indian citizens are painful:
Even if digital payments become extremely convenient, people may still want to hold cash because they don't fully trust governments, institutions, policies, infrastructure or the long-term stability of the system.
For example:
The 2016 demonetisation (demon or cash ban) experience showed that government policy can abruptly affect people's access to money.
In Nov2016, the RBI implemented demonetisation with little apparent resistance, though it was unclear how much choice the central bank had. Such instances reinforce public's poor perception of insitutions in India.
Banking outages, payment network failures, debanking, spectacular bank failures like PMC Bank, internet disruptions, deliberate internet shutdowns by governments and power cuts remind people that digital systems are not fully dependable.
Recent debanking episodes: In Canada, during the 2022 trucker protests, authorities froze some bank accounts under emergency powers, raising concerns about financial access being politically restricted. In the UK, NatWest Group closed Nigel Farage’s bank account sparking huge debate about debanking.
The fact that nearly three-fourths of Indian household wealth is held in real estate and gold reflects a broader distrust of formal financial institutions. Even beyond how people pay or use banks, the way Indians invest their money shows a tendency to prefer tangible assets, rather than those managed by financial institutions.
In environments where trust in institutions is limited, people often value direct control over at least part of their savings and transaction balances.
Sidenote: The data used here are from the old GDP series with base year 2011–12, and official figures are expected to be updated to the new 2022–23 base. MOSPI, Govt of India, will be announcing GDP estimates for FY 2025-26 this evening (that is, 05Jun2026).
While exact numbers may change, the broad conclusion that CIC broadly tracks nominal GDP over the long run is unlikely to change.
RBI Occasional Papers 28Nov2023: Cash versus Digital Payment Transactions in India: Decoding the Currency Demand Paradox
The Hindu article 28Nov2023 on cash and digital payments
(Check "Key Insights..." just under the chart below)
Chart 136 showing India currency in circulation growth over the past 14 years from 2011-12 to 2025-26, stacked against nominal GDP growth and CPI inflation >
Key insights from an RBI Occasional Paper of Nov2023 titled: "Cash versus Digital Payment Transactions in India: Decoding the Currency Demand Paradox," by Sakshi Awasthy, Rekha Misra and Sarat Dhal >
Core idea:
Digital payments are growing quickly, but currency in circulation (CIC) is also increasing (instead of formal CIC, sometimes the therm 'cash' is used). This situation in India is not actually a contradiction.
This happens because cash (short for CIC) and digital money are not doing the same job anymore. They are growing in different roles at the same time.
Cash for spending is being replaced:
For everyday payments like buying groceries or small shop transactions, digital systems like UPI are replacing cash. People are using less cash for these small and frequent payments. As digital payments become extremely common, people have less demand for cash at least for transactions.
This is seen in the decline of small notes and reduced cash withdrawals from ATMs for daily spending.
Cash for saving and safety is still strong:
Even though cash is used less for spending, people still keep cash as a form of savings or backup. They hold it for safety during uncertain times or emergencies.
This is why higher value notes like Rs 500 are becoming more common. It shows people are keeping larger amounts of cash at home or outside banks.
In essence, cash is serving the dual purpose of:
> a means of payment, and
> a store of value.
Why both cash and digital grow together:
India’s economy is growing, so overall money use is increasing. As incomes rise, people naturally need more money for both spending and saving.
Digital payments are taking over some of the spending role, but not enough to reduce total cash demand. So both systems expand at the same time.
What drives cash demand:
Three main forces keep cash demand strong.
First, higher income levels increase the need for money in general. More economic activity means greater demand for all payment methods.
Second, uncertainty or risk makes people hold cash as a safety buffer. People still hold cash for precautionary reasons, like, emergencies and convenience -- because in such situtions digital payments may not be available or dependable.
Third, lower interest on bank savings makes holding cash less costly than before.
What happened during the pandemic:
During COVID-19, people held more cash because they were uncertain about the future. At the same time, the economy slowed down, which made the ratio of cash to GDP look unusually high.
This was a temporary effect and not a permanent change in behavior.
Cash still matters in the economy:
Cash is still important for parts of the economy where digital systems are not fully used. This includes informal jobs, rural areas and people who do not have full access to banking or digital tools.
India's informal sector often depends on cash settlements.
Because of this, cash continues to circulate even as digital payments grow.
Policy direction:
The goal of policy is not to remove cash but to improve digital payment systems. This includes making digital payments cheaper, easier to access and safer.
Better internet access, financial education and strong cybersecurity are also important. The idea is to make digital payments work for more people, not to eliminate cash.
Final conclusion:
Digital payments are replacing cash only in how people spend money, not in how they store it. Cash is becoming less important for transactions but still important as savings and backup money.
Because of this split, both cash and digital payments can grow at the same time in India.
--------------------------------------------------------------
Update 29May2026: Charts 133 to 135:
India Banking Infrastructure: ATMs, Debit cards and Credit cards:
The following three charts show number of outstanding ATMs, CRMs, debit cards and credit cards as at the end of every December for the past six years (Chart 1 below).
They also show value of credit and debit card transactions in India. These two charts (2 and 3) show only value of transactions for the month of December only for four years between Dec2022 and Dec2025.
Outstanding number of ATMs, debit and credit cards:
ATMs are automated teller machines and CRMs are cash recycling machines.
Micro ATMs are devices used by business correspondents of banks to deliver basic banking services to customers.
Micro ATMs are portable and handheld card-reading devices and can be used to dispense cash to customers in remote locations where hole-in-the-wall ATMs are not available.
The data pertain to all banks in India, namely, public sector banks (PSBs), private sector banks (PVBs), foreign banks in India, payment banks and small finance banks (SFBs).
Practically, there is no growth in number of ATMs and CRMs with banks in India in the past six years. In fact, India saw a decline of nearly 2,100 ATMs and CRMs over the six years from Dec2019 to Dec2025.
However, the annual growth in micro ATMs is huge at 23.1 per cent in the past five years.
As of Dec2025, there are 2.07 lakh ATMs and CRMs, 14.15 lakh micro ATMs, 1,160 lakh credit cards and 10,340 lakh debit cards.
Hard to believe that banks in India have issued more than 100 crore debit cards.
While annual growth in credit card numbers is 13.1 per cent, the growth in debit cards is subdued at 4.3 per cent in the past six years. However, the outstanding debit cards are nearly nine times those of total outstanding credit cards.
The debit-to-credit card ratio has steadily declined over the years, falling from 14.55 in Dec2019 to 8.93 in Dec2025.
Value of credit and debit card transactions during December:
Due to the so-called Digital India policies of the Indian government, there is tremendous growth in the digital transactions in India in the past six years (the trend started after the Nov2016 demonetisation fiasco).
Online merchant transactions have exploded. More transactions have been taking place using UPI (Unified Payment Interface) mechanism, whilst usage of debit cards by bank customers has dwindled (debit cards are primarily used for ATM cash withdrawals by customers).
The big surge in UPI transactions has negatively impacted merchant transactions through debit cards. The negative impact of UPI on credit cards is less severe compared to debit card transactions, as the multi-year data presented below show.
However, the six-year annual growth of credit cards is 13.1 per cent, the growth in debit cards is just 4.3 per cent. The higher growth in credit card numbers may have dampened the impact of UPI on the value of credit card transactions.
Customers' usage of credit and debit cards includes point of sale (PoS) transactions, online merchant transactions for e-commerce and ATM cash withdrawals.
ATM withdrawals are meagre via credit cards, compared to debit cards. Of the total value of debit card transactions, ATM cash withdrawals account for more than 85 per cent of the total.
With debit cards, value of PoS transactions is nearly double that of online / e-commerce. But with credit cards, value of online / e-commerce transactions is more than 160 per cent of PoS transactions.
Overall, total value of transactions of PoS and online / e-commerce are higher for credit cards compared to debit cards -- ignoring ATM cash withdrawals.
As the number of credit cards has experienced an absolute growth of 43 per cent in the passt three years (between Dec2022 and Dec2025), the total value of credit card transactions has gone up by an absolute growth of 62 per cent between Dec2022 and Dec2025. During the month of Dec2025, the credit card transactions amount to Rs 2.05 lakh crore.
One interesting thing is: While the total value of PoS and online / e-commerce transactions via debit cards has shown a huge decline between Dec2022 and Dec2025, the growth in the value of PoS and online / e-commerce transactions via credit cards is showing a huge growth (see charts below).
Sidenote: One fool, then with Niti Aayog, in Jan2017 predicted the demise of ATMs, credit cards and debit cards in 2.5 years. No such thing has happened even though the deadline has passed six years ago. He also predicted death of banks itself! 😀
The analysis above has implications for some of the listed companies, in India, such as:
SBI Cards & Payment Services Ltd
CMS Info Systems
Radiant Cash Management ServicesAGS Transact Technologies (now virtually bankrupt)
Three charts showng data of Indian banking infra, ATMs, debit and credit cards and value of transactions >
--------------------------------------------------------------
Update 07May2026: Charts 127 to 132:
Mutual Fund Assets: Growth of India Passive Equity Funds AUM (10 years data):
Mutual Fund net inflows: India Passive funds net inflows (7 years data):
Mutual Fund net inflows: India Passive funds net inflows (only FY 2025-26 data with Break up data):
Additional data charts: Top 5 AMCs offering ETFs / Index funds by AUM; and ETFs tracking Nifty 50 index
Complement this data with:
several updates here on mutual funds AUM
Chart 1: Passive Equity AUM growth: During FY 2025-26, total assets under management (AUM) of passive
equity funds (both ETFs as well as index funds) grew by just Rs 0.81 lakh crore or 7.8 per cent -- the growth rate has considerably slowed compared to previous years (see chart below for past 10 years data).
In
the same period, the ETF asset growth is 7.8 per cent while that of
index funds is 17 per cent from a lower base. The share of ETFs in the total passive pie
is 78.3 per cent.
As of 31Mar2026, the total number of equity ETF schemes are 246 and the number of index funds are 248, totaling 494.
The number of indices tracked by equity ETFs and equity index funds are no longer made available (Nifty Indices used to provide this data for earlier, but no longer -- in addition, Nifty Indices changed the data formats in their latest updates; making it impossible for data users to retrieve useful data).
AUM growth rates as of 31Mar2026:
1-year growth rates (yoy):
7.8% equity ETFs
17.0% equity index funds
9.6% equity passive funds
3-year absolute growth rates:
81% equity ETFs
259% equity index funds
103% equity passive funds
5-year growth absolute rates:
202% equity ETFs
1002% equity index funds
259% equity passive funds
It may be noted 3-year and 5-year growth rates appear extraordinary but they are from a lower base.
data: NSE India passive funds - monthly data available
Chart 2: Mutual Fund net inflows: India Passive funds net inflows: data include ETFs and Index funds for all asset classes, namely, equity, debt and commodity segments:
During FY 2025-26, the net inflows are Rs 1.81 lakh crore for ETFs
and Rs 0.26 lakh crore for index funds -- total passive funds being Rs 2.07 lakh crore. The share of ETFs in total passive inflows is 87.5 per cent for the year.
Growth rates of net inflows as of 31Mar2026:
1-year growth rates (yoy):
118% equity ETFs
minus 56% equity index funds
45% equity passive funds
3-year absolute growth rates:
201% equity ETFs
minus 73% equity index funds
33% equity passive funds
5-year growth absolute rates:
288% equity ETFs
466% equity index funds
304% equity passive funds
Please note these growth rates are from a lower base.
Read more:
Decoding the Nifty Midcap 150 Quality 50 Index: A Midcap Strategy Built on Fundamentals
Chart: India Passive Equity Funds net inflows (Equtiy + Debt + Commodity; and both ETFs and Index funds tracking BSE as well as NSE / Nifty equity indices) (7 years data) >
Chart 3: Mutual Fund net inflows: India Passive funds net inflows: data include ETFs and Index funds for all asset classes, namely, equity, debt and commodity segments (only FY 2025-26 data with Break up data):
The data are self explanatory.
However, passive funds in debt category have suffered net outflows of Rs 0.08 lakh crore in 2025-26. I don't remember when was the last time debt passive funds suffered outflows in a financial year.
This net outflow is a rare and possibly unprecedented occurrence — likely reflecting the lingering impact of the 2023 taxation changes that stripped away the key tax advantage that had made debt funds attractive to investors.
In addition, during FY 2025-26, Indian bond yields have risen, with debt funds returning meagre returns -- possibly, some investors exited the category. The shift of investor flows toward equities and higher-risk assets may have further weighed on the category.
Together, these trends mark a notable break for the debt category.
Note on NSE India data presentation standards:
Though Nifty Passive Insights provide vast amount of good data points, granular data on passive funds inflows — broken down by asset class and fund type — are currently available only for FY2025-26, limiting longer-term trend analysis.
The data are presented in image-based charts, making extraction tedious and time-consuming. NSE India / Nifty Indices don't even provide annual net inflows data; one has to manually extract annual data from monthly charts. What a waste of time!
The Nifty Passive Insights reports published by National Stock Exchange of India and Nifty Indices reflect alarmingly poor data quality and presentation standards for institutions of such market significance.
Additional data charts: Top 5 AMCs offering ETFs / Index funds by AUM; and ETFs tracking Nifty 50 index
Three charts:
Top 5 AMCs offering ETF Schemes by AUM ( equity-, debt- and commodity-oriented ETFs) >
Top 5 AMCs offering Index Fund Schemes by AUM (equity- and debt-oriented ETFs) >
ETFs tracking Nifty Indices and their AUM (for example, Nifty 50 TRI) >
--------------------------------------------------------------
Update 28Apr2026: Chart 126:
Lending Rates of Banks in India :
(Refer:
Update 13Jan2026 with Chart 103 below,
Blog 13Jun2010 New Base Rate System of Bank Loan Pricing, and
India's banking regulator RBI introduced External Benchmark Based Lending in Sep2019,
making it mandatory for all new floating rate personal or retail loans
and floating rate loans to Micro and Small Enterprises (MSMEs).
Later the scope of External Benchmark Based Lending was extended to Medium Enterprises also.
Since then, Banks in India have been offering personal or retail loans (like housing, auto and others) and MSME loans based on external benchmark lending rates (EBLR).
External benchmarks of banks in India (approved by RBI) are:
1. RBI LAF policy repo rate
2. 91-day Treasury bill yield published by FBIL
3. 182-day Treasury bill yield published by FBIL
4. Any other benchmark market interest rate published by FBIL
FBIL is Financial Benchmarks India Pvt Ltd, a financial benchmark setter supervised by RBI.
Internal benchmark interest rates, like, base rate and BPLR have largely become irrelevant now -- with banks lending only a tiny portion of their total outstanding loans through base rate and BPLR.
Other salient features of EBLR:
> a bank is free to offer such external benchmark linked loans to other types of borrowers as well.
> the interest rate under external benchmark shall be reset at least once in three months.
External benchmark rate means a reference rate which includes RBI repo rate and / or other rates approved by RBI.
Internal benchmark rate means a reference rate determined internally by a bank in India.
As per RBI data, the share of total outstanding floating rate rupee loans (of 74 SCBs in India) as of 31Dec2025 is:
65.4% EBLR or external benchmark-based lending rate
32.0% MCLR or marginal cost of funds based lending rate
2.6% Others (include BPLR or benchmark prime lending rate and Base rate)
As shown in the chart below, the lion's share of bank lending in India is linked to EBLRs (which is good for monetary policy transmission or MPT).
RBI press release 30Mar2026 on Lending rates of SCBs
Refer Tweet 28Apr2026 for RBI circulars withdrawn / repealed and issue of consolidated Master Directions (The Sep2019 RBI circular on External Benchmark Based Lending was withdrawn in Nov2025 and was replaced by a consolidated Master Direction)
Chart showing data on share of EBLR and MCLR in outstanding bank loans >
--------------------------------------------------------------
Update 28Apr2026: Chart 125:
QIP funds raised by India Inc:
References:
Check these in the same blog >
Update 02Dec2025 with Chart 92
Update 16Dec2024 with Chart 29
Data from FY 2006-07 to FY 2025-26 >
OVERVIEW
This is a short anlysis of QIP or qualified institutional placements raised by India Inc in the past 20 years. The absolute rupee numbers dominate media coverage, but they are deeply misleading given that BSE market capitalisation has grown more than 10 times over this period.
The only honest way to read this data is through the normalised column — QIP as a percentage of average BSE market cap.
LONG-RUN AVERAGE IS THE ANCHOR
The 20-year average sits at just 0.27 per cent of average BSE market capitalisation. That single number reframes everything else. QIPs have been a structurally modest and disciplined fundraising channel for most of this period, not a dominant force in Indian capital markets.
RECORD YEAR IS ORDINARY WHEN NORMALISED
2024-25 generated enormous commentary as a record year with 85 issues and Rs 1.33 lakh crore raised. In normalised terms it was 0.33 per cent — marginally above the long-run average. Unremarkable by any serious measure.
THE REAL OUTLIER IS 2009-10
The only year that genuinely stands apart is 2009-10 at 0.91 per cent, and the reason is specific — it was a post-Lehman Brothers collapse catch-up.
Companies starved of capital through the 2008-09 freeze, when just two issues raised effectively nothing, rushed to tap markets once valuations reset. That 0.91 per cent is a crisis-recovery anomaly, not a normal market signal.
2025-26 LOOKS SUBDUED
At Rs 0.63 lakh crore (29 issues) QIP raised with normalised rate of 0.15 per cent in 2025-26, the year was well below the long-run average.
CONCLUSION
Market participants and the media need to focus less on the total money raised and more on how big it is compared to the overall market. That comparison tells the real story.
Without it, rising market size over the years can make every new “record” look exciting—even when nothing unusual is actually happening.
Note 1: It's a better to take a comprehensive look at equity fund raising rather than looking at QIPs alone: see below >
CY 2024 data (11 months till Nov2024)
27% promoter exit
21% Private equity (PE) exit
27% QIPs / FPOs
25% IPOs
(in addition to the above, you need to track equity rights issues and preferential issues of companies)
Note 2: During stock market euphoria, it would be beneficial for companies (not necessarily for equity shareholders) to raise equity capital.
But one could say raising of new equity capital would be good for bond holders as the risk of their default comes down, ceteris paribus.
Data sources:
Labels: promoter selling / insider exits - QIP fund raising - equity capital raising - data context - data contextualisation - need to contextualize data -
Chart showing data for the past 20 years > QIP raised data normalised with average BSE market cap to provide proper context >
--------------------------------------------------------------
Update 28Apr2026: Chart 124:
How Rates and Ratios are Moving : (previous blog dated 26May2022)
The
following charts provides data on key interest rates and ratios of
interest rate market in India. The rates and ratios range from CPI
inflation, Policy repo rate, lending and deposit rates, short-term rates
such as call money and Treasury bill yields, long term bond yields and
government-administered small savings rates of PPF, NSC and post office
deposit rates.
The chart shows how key Indian interest rates and financial ratios have moved over the past two years (eight quarters data), giving the reader a single-glance snapshot to track whether borrowing is getting cheaper / costlier, savings rates are shifting and inflation is rising or falling — essentially a quarterly dashboard of India's monetary and financial landscape.
By looking at data over medium and long periods, one can glean some insights.
Mar2026 quarter update:
Weighted average lending rate (WALR) of scheduled commercial banks (SCBs) and MCLR overnight have fallen in the past one year, with RBI reducing CRR by 100 basis points and repo rate too by 100 basis points.
In the past one quarter (between Dec2025 and Mar2026), real interest rate has been halved to 1.85 per cent as CPI has surged.
In line with RBI rate cuts, call money rates in the past one year have decreased.
One striking feature in the past one year has been that bank term deposit rates (one year) have remained sticky even as bank lending rates have fallen. However, banks have slashed their savings bank deposit rates.
Another peculiar feature is 10-year government bond yield has increased even as RBI has cut both CRR and repo rate -- this is quite unusual in India's bond market history.
Govt of India has kept small savings deposit rates constant for more than two years.
Note: CPI inflation for Mar2026 is as per new CPI 2024 series data, while for other quarters, the data are as per old CPI 2012 series data.
Chart:
Quarterly data (Mar2024 to Mar2026) of rates and ratios >
Please click on the chart to view better>
--------------------------------------------------------------
Update 17Apr2026: Chart 123:
India Mutual Funds Gross Underperformance: SPIVA Report highlights: SPIVA India Scorecard: Refer blog 22Feb2023 'Why do Indian Equity Mutual Funds Always Disappoint Investors?' and Tweet thread 12Apr2023)
The chart below compares the percentage of mutual funds underperforming their benchmark indices across different Indian equity fund categories.
It breaks this down by time horizon (1, 3, 5, and 10 years) and multiple observation dates to show how relative performance evolves over time.
The data are from SPIVA Report with latest data as of 31Dec2025:
Overall Shift from Large-Cap Weakness to Mid-Small Cap Strength (Jun 2025 vs Dec 2025):
The chart compares the share of funds underperforming benchmarks across categories and time horizons.
The most important change between Jun 2025 and Dec 2025 is a clear divergence: large-cap and ELSS funds generally worsened in short-term performance, while mid-small cap funds improved sharply across almost all horizons.
Large-cap funds:
For example: In large cap category, 42 per cent of India equity large cap funds underperformed as of 30Jun2025 (coversely, 58% of funds outperformed the respecitve benchmark index) on a 1-year basis.
But as of 31Dec2025, the return performance worsened with 75 per cent large cap funds underperforming the 1-year benchmark return.
MidSmall cap funds:
In MidSmall cap cateogory, 80 per cent of India equity MidSmall cap funds underperformed as of 30Jun2025 (conversely, only 20% of funds outperformed the index) on a 3-year basis.
By 31Dec2025, the return performance of MidSmall cap category improved, with only 42 per cent of funds underperfomring (or 58 per cent outperforming) the 3-year benchmark return.
According to S&P Global, active MidSmall cap funds delivered a majority outperformance (data as of 31Dec2025), marking their best relative results since 2014.
ELSS category:
ELSS funds show a split pattern. Short-term underperformance worsened sharply: 1-year underperformance rose from 36 per cent to 69 per cent, and 3-year edged up from 53 per cent to 55 per cent. However, longer horizons improved.
The 5-year underperformance rate dropped from 68 per cent to 59 per cent, and the 10-year improved from 86 per cent to 83 per cent.
This indicates improving long-term relative stability, but weaker recent performance versus benchmarks.
Key Interpretation: Performance Leadership Rotated Toward MidSmall Caps:
Between Jun2025 and Dec2025, performance leadership clearly shifted. Large cap and ELSS funds saw deterioration in recent relative returns, while MidSmall caps experienced a sharp improvement across nearly all time horizons.
The data suggest either a favorable environment for active management in smaller segments or improved stock selection skill in that space, while large cap active managers struggled more against benchmarks in the most recent period.
Green highlights in the chart indicate categories where fewer than 50 per cent of funds are underperforming the benchmark, meaning a majority of funds are actually outperforming the index in that time horizon.
Orange highlights mark the weakest relative performance in that column or time period, where underperformance is highest and therefore the category is lagging the benchmark the most.
Data:
Tweet thread 17Apr2026 raw data - check how much return the benchmarks and the MF categories performed
Chart showing SPIVA data on India Mutual Funds Gross Performance > data for the past four half-year periods >
--------------------------------------------------------------
Update 13Apr2026: Charts 121 and 122:
Mutual Fund Assets: Growth of India Mutual Fund Industry: Mutual Fund AUM data (For a detailed analysis, please refer to the blog dated 18Jul2024)
In
the 2025-26 financial year, India's mutual fund industry experienced a moderate 12 per cent growth in assets under management (AUM), as per AMFI data.
The growth rate was impacted negatively due to sharp fall in Indian stocks in Jan-Mar2026 quarter.
The
industry's total assets grew from Rs 65.74 lakh crore on 31Mar2025 to
Rs 73.73 lakh crore by 31Mar2026.
In comparison, the aggregate deposits of India's scheduled commercial banks (SCBs) as on 15Mar2026 are Rs 250 lakh crore.
Two charts:
Growth from 2000 to 2012 >
Growth from 2013 to 2026 >
--------------------------------------------------------------
Update 13Apr2026: Chart 120:
Mutual Fund Assets: India Passive Funds AUM Data: Passive Funds asset size (ETFs and Index funds of equity, debt and commodities): MF AUM data:
As of 31Maar2026,
total passive funds' AUM (assets under management) in India is Rs 13.73 lakh crore -- covering all ETFs (exchange trade funds) and index funds
across Equity, Debt and Commodities. Commodities include gold and
silver.
Break up of the total passive funds' AUM is as follows:
Asset-wise split:
Equity Passive Funds (ETFs + Index funds):
Equity
is the largest component of passive investing in India. Total equity
passive AUM is Rs 9.17 lakh crore, accounting for roughly tw0-thirds of all passive assets.
This shows that equity ETFs are the primary driver of passive fund growth in India.
Within equity:
ETFs hold Rs 7.18 lakh crore.
Index funds hold Rs 1.99 lakh crore.
Check the chart below for the following data:
Debt Passive Funds (ETFs + Index funds):
Commodities Passive Funds (Only ETFs):
ETF vs Index Fund Comparison:
As on 31Mar2026, total ETF AUM is Rs 10.66 lakh crore, bulk of which is from equity.
ETFs make up more than three-fourths of the total passive fund market.
data: NSE India passive funds - monthly data available Chart 120 click on the image to view better >
--------------------------------------------------------------
Update 13Apr2026: Charts 119:
Share of Total Equity AUM in Total Mutual Fund Industry AUM: Equity Asset Size: (see Update 10Feb2026 below with three charts for more)
Share of Total Equity AUM in Total Industry:
The share of total equity (including active and passive) AUM in total
mutual fund industry has grown rapidly from about one-third in Mar2017
to about 55.8 per cent by Mar2026.
31Mar2017 (Rs lakh crore):
5.44 active equity
0.46 passive equity
5.89 total equity
33.6% share of equity in total MF industry
31Mar2026 (Rs lakh crore):
31.98 active equity
9.18 passive equity
41.16 total equity
55.8% share of equity in total MF industry
Growth rates of active and passive assets as on 31Mar2026:
1) Active equity assets are Rs 31.98 lakh crore as at the end of Mar2026 and passive equity AUM size is Rs 9.18 lakh crore, totaling Rs 41.16 lakh crore.
The equity asset size has come down compared to Dec2025, as Indian stocks suffered sharp drawdown in Jan-Mar2026 quarter.
Active equity assets growth rates:
1-year: 8.6%
3-year CAGR: 28.2%
5-year CAGR: 26.7%
2) Passive equity assets growth rates:
1-year: 9.7%
3-year CAGR: 26.6%
5-year CAGR: 29.1%
3) Total asset size of Indian mutual fund industry is Rs 73.73 lakh crore as of 31Mar2026, which has decreased from Rs 8.23 lakh crore.
Total MF industry assets growth rates:
1-year: 12.2%
3-year CAGR: 23.2%
5-year CAGR: 18.6%
Chart 119 showing share of India Total Equity AUM in total MF Industry AUM (data for the past 10 years) >
--------------------------------------------------------------
Update 02Apr2026: Charts 117 and 118:
India GST Collections: Goods and Services Tax: Gross GST revenue collections, refund data and net GST revenue collections (Blog: Is GST growth now tracking nominal GDP? -- look for collection efficiency or C-efficency in the blog; and Tweet thread 01Jul2017 on GST):
(Note: Mar2025 figures given in Mar2026 GST Collections report do not match with those given in Mar2025 GST Collections report -- no explanation for the difference is given by GST Council).
Overall trend:
GST collections in India show a steady upward trajectory post FY 2020-21 recovery, with net GST rising from Rs 10.12 lakh crore in FY 2020-21 to Rs 19.35 lakh crore in FY 2025-26 (till Mar2026).
While the 5-year growth of 91.2 per cent and CAGR of 13.8 per cent appear strong, they are distorted by the low base of FY 2020-21 during the COVID-19 shock. The more relevant trend is captured in the 3-year growth of 21.8 per cent and CAGR of 6.8 per cent, along with the latest 1-year growth of 7.1 per cent, which better reflect the normalized growth phase.
FY 2025-26 snapshot (till Mar2026):
Gross GST stands at Rs 22.27 lakh crore and net GST at Rs 19.35 lakh crore, with refunds at Rs 2.92 lakh crore. YoY net growth is 7.1 per cent, consistent with the normalised growth range. Average monthly net is Rs 1.61 lakh crore, the highest so far, with moderate growth in the past three years.
Growth normalisation insight:
The apparent divergence between the 5-year CAGR of 13.8 per cent and the 3-year CAGR of 6.8 per cent is primarily a base effect. FY 2020-21 represents an unusually depressed starting point due to pandemic-related disruptions, inflating the longer-term growth metrics.
Current growth in the 7–8 per cent range suggests GST revenues are now tracking nominal economic growth, with limited incremental gains from compliance improvements.
Monthly trends (recent months):
Mar2026 recorded gross Rs 2.00 lakh crore and net Rs 1.78 lakh crore with 8.2 per cent YoY growth. Jan2026–Mar2026 show stable high collections (net Rs 1.61–1.78 lakh crore) with roughly 7.6–8.2 per cent growth, in line with the 1-year trend of 7.1 per cent.
Some volatility remains, with Oct2025 and Nov2025 showing muted growth (0.6 per cent and 1.3 per cent), reinforcing the moderation narrative (GST cuts were effected in Sep2025).
Refund dynamics:
Refunds have increased in absolute terms (Rs 2.92 lakh crore in FY 2025-26 vs Rs 2.48 lakh crore in FY 2024-25).
Long-term perspective:
GST was rolled out effective from 01Jul2017. The sharp contraction of FY 2020-21 (negative 17.2 per cent growth) creates a statistical distortion in multi-year comparisons. Adjusting for this, the system now appears to have entered a steady-state growth phase.
Key takeaway:
GST revenues are strong in absolute terms when you look at monthly averages, but growth has clearly normalised. The 5-year growth metrics overstate momentum due to the pandemic base effect, while the 3-year CAGR of 6.8 per cent and recent 1-year growth of 7.1 per cent provide a more accurate picture of sustainable trends going forward.
As can
be seen from the below chart, these YoY growth rates are volatile and
not much can be gleaned from the data.
One may have to see more granular data to analyse the monthly GST data.
GST refunds explained:
The data:
Financial Refunds as %
Year of Gross GST
2025-26 13.1%
2024-25 12.1%
2023-24 10.8%
2022-23 12.2%
2021-22 12.3%
2020-21 11.0%
The trend is clearly moving upward, with FY 2023-24 marking a trough at 10.8 per cent, followed by two consecutive increases to 12.1 per cent in FY 2024-25 and 13.1 per cent in FY 2025-26. A 230 basis point rise over two years brings the ratio to a series high, suggesting a shift rather than a one-off fluctuation.
That said, this rise should not be viewed as inherently negative. A higher refund ratio can reflect a more efficient GST system where input tax credits (ITC) are being processed faster, especially for exporters.
The fact that the increase is sustained over two years points away from temporary factors like backlog clearance and toward underlying structural or compositional drivers.
The more plausible explanation is a combination of factors. Export growth relative to domestic demand can mechanically push up the ratio, given that IGST refunds on exports form a large share.
Persistent inverted duty structures in certain sectors can also lead to systematic credit accumulation and higher refund outflows. At the same time, improvements in compliance and GSTN systems may be bringing more legitimate refund claims into the net.
Finally, if recent GST growth is being driven more by manufacturing and export-oriented sectors than services, the aggregate refund intensity would naturally rise [* see note below on divergence between manufacturing and services].
The key risk is not the level per se, but whether it continues to rise without corresponding economic drivers. At 13.1 per cent, roughly Rs 1 out of every Rs 7.60 collected is being refunded.
This is not alarming, but if the ratio moves toward 14–15 per cent without clear support from exports or sectoral shifts, it could start raising questions about structural inefficiencies such as unresolved inverted duty structures or aggressive credit claims.
Overall, the current increase looks consistent with a maturing and more efficient system, but it warrants close monitoring to ensure it remains aligned with real economic activity rather than distortions.
Distortions refer to structural or policy inefficiencies—like inverted duty structures, rate mismatches or aggressive ITC claims—that inflate refunds beyond what real economic activity would justify.
They become a concern when refund growth outpaces drivers like exports or manufacturing, signalling weakening efficiency in net GST collections rather than just better system functioning.
* A note on GST refunds' divergence between manufacturing and services:
Manufacturing and export-oriented sectors typically have higher input costs and are eligible for input tax credit refunds (especially exports, which are zero-rated), so a larger share of GST paid gets refunded.
In contrast, services tend to have lower input intensity and fewer refunds, so if overall GST growth shifts toward manufacturing/exports, the system naturally sees a higher proportion of refunds.
In the GST framework, the refund ratio is a function of "Value Added."
Manufacturing / Exports: These are high-input sectors. A mobile phone manufacturer might spend 70-80% of its final price on taxed components (screens, chips, batteries). If they export that phone, the government must refund the tax on that entire 80% input cost.
Services: A software firm or a consulting agency has very low physical input costs—mostly salaries (which don't carry GST) and office rent. Their input-to-output tax ratio is tiny. Therefore, they rarely claim significant refunds.
data sources:
Two charts:
1. Monthly Gross / Net GST Collections, with refunds, from Jan2025 to Mar2026:
2. Yearly Gross / Net GST collections, with refunds, from 2017-18 till 2025-26:
Charts 117 and 118 click on them to view better >
--------------------------------------------------------------
Update 23Mar2026: Chart 116:
India coal production, imports and coal import dependency: Domestic Production Drives Coal Growth, Cutting Import Dependence:
Overview:
India’s coal demand continues to rise, but import dependence has declined recently due to strong growth in domestic production.
Production vs Imports Trend:
Domestic production increased steadily from 609 million tonnes in 2014-15 to 1,047 million metric tonnes in 2024-25. Imports fluctuated but stayed broadly in the 190–265 million tonne range, showing no long-term growth.
Import Dependency Trend:
Import dependency peaked around mid-2010s levels (25.8 per cent in 2014-15, 25.4 per cent in 2019-20). It then declined to 18.9 per cent in 2024-25, the lowest in the series. Its decline by seven percentage points in the past decade is decent.
Recent Improvement:
From 2020-21 onward, domestic output growth outpaced import growth. This reduced dependency from 23.1 per cent to 18.9 per cent in four years.
Key Insight:
India is reducing reliance on coal imports primarily by expanding domestic production rather than cutting absolute imports significantly.
Risk / Structural Issue:
Despite improvement, imports remain substantial in absolute terms (over 200 million tonnes), indicating continued dependence for specific coal types (especially coking coal used primarily in India steel sector).
However, for reasons not yet clear, domestic coal production slipped slightly to 927 MMT in FY 2025-26 (11-month data), down from 929 MMT in the same period last year.
Bottom Line:
India has made clear progress in lowering coal import dependence, but structural reliance persists, and further gains depend on sustaining high domestic production growth.
Past decade growth:
Absolute Increase (2014-15 to 2024-25):
Domestic production increased by 438 million tonnes.
Imports increased by 32 million tonnes.
Total coal availability increased by 470 million tonnes.
Absolute growth (2014-15 to 2024-25):
Domestic production increased by 72 per cent.
Imports increased by 15 per cent.
Total coal availability increased by 57 per cent.
Interpretation:
The vast majority of incremental supply came from domestic production, contributing over 90 per cent of the total increase, while imports played a limited role.
Key Takeaway:
India’s coal growth story over the last decade is overwhelmingly driven by domestic expansion, which explains the decline in import dependency despite rising total demand.
Of India's total production, Coal India Ltd contributes nearly three-fourths.
Indeed, Thiru PM Modi government deserves praise for significantly boosting domestic coal production, which has helped reduce India’s coal import dependency and strengthen energy security.
Data sources:
Tweet 23Mar2026 raw data with image
Coal controller organisation data
Ministry of coal - imports and exports
Ministry of coal - imports PDF
PIB press release 21Mar26
Monthly coal production data
Feb2026 PDF
Import and production data till Dec2025
Chart 116 click on it to view better >

--------------------------------------------------------------
Update 01Mar2026: Charts 114 and 115:
India GST Collections: Goods and Services Tax: Gross GST revenue collections, refund data and net GST revenue collections (Blog: Is GST growth now tracking nominal GDP? and Tweet thread 01Jul2017 on GST):
Monthly collections:
Gross GST revenue collections in Feb2026 are Rs 1.84 lakh crores. Net GST revenue collections (net of
refunds) in the same month are 1.61 lakh crore, an improvement of 7.9 per cent over Feb2025 (Note: Feb2025 figures given in Feb2026 GST Collections report do not match with those given in Feb2025 GST Collections report -- no explanation for the difference is given by GST Council).
As can
be seen from the below chart, these YoY growth rates are volatile and
not much can be gleaned from the data.
One may have to see more granular data to analyse the monthly GST data.
For
the financial year 2025-26 (11 months till Feb2026), the net GST
collections are Rs 17.57 lakh crore, showing a YoY growth of 6.9 per cent
compared to Apr2024-Feb2025 period (see two charts below for data).
Average monthly Net GST Collections:
During FY 2025-26 (11 months data), the average monthly
net GST collections are Rs 1.60 lakh crore, compared to average monthly
figure of Rs 1.49 lakh crore for the correponding period of FY 2024-25 (see chart below).
Due
to inflationary pressures and other factors, average monthly net GST
collections improved from Rs 0.98 lakh crore for full FY 2018-19 to Rs
1.60 lakh crore now.
Net GST revenue equals gross GST revenue minus GST refunds. GST refund data prior to 2020-21 aren't available with GST Portal.
data sources:
Two charts:
1. Monthly Gross / Net GST Collections, with refunds, from Sep2024 to Feb2026:
2. Yearly Gross / Net GST collections, with refunds, from 2017-18 till 2025-26:
Charts 114 and 115 click on them to view better >


--------------------------------------------------------------
Update 28Feb2026: Charts 112 and 113:
India GDP New Series (base year 2022-23) >
Complement this data with:
Blog 1: From Farms to Factories to Services: India’s GDP Explained via Production Approach 22Feb2026
Blog 2: Understanding India’s GDP – A Simple Guide to the Expenditure Approach 18Feb2026
Tweet thread 28Feb2026 - India GDP New Series (base year 2022-23) - methodology changes - ACNAS - background - key points of GDP revisions - Pronab Sen interview
Tweet thread 28Feb2026 - India GDP New Series (base year 2022-23) - GDP / GVA for recent years and GDP growth rates
India's MoSPI (Ministry of Statitistics and Programme Implementation) released a press note (62-page PDF) on 27Feb2026 detailing GDP estimates under new series with base year as FY 2022-23.
Here are the top seven key points from the press note:
1. New Base Year (2022–23): The base year for National Accounts has been shifted from 2011–12 to 2022–23. This "post-pandemic" benchmark was chosen to better reflect the current structure of the economy, including the digital shift and the gig economy.
2. Real GDP growth for FY 2025–26 is estimated at 7.6 per cent, an upward revision from the 7.4 per cent projected in January under the old series. Nominal GDP for the year is now pegged at Rs 345.47 lakh crore.
3. Adoption of "Double Deflation": MoSPI has moved away from "Single Deflation." It now deflates output and input prices separately to calculate real GVA or gross value added. This is likely to improve accuracy in sectors like manufacturing where raw material price volatility (like oil / steel) often distorted growth figures.
4. Integration of New Data Sources: The methodology now formally integrates high-frequency data from GST (Goods and Services Tax), e-Vahan (vehicle registrations) and the MCA-21 corporate database. It also incorporates the latest findings from the ASUSE (unincorporated enterprises) and PLFS (labor force) surveys.
5. The new series uses the Supply and Use Table (SUT) framework to reconcile production and expenditure data. This "product-balancing" principle aims to minimise the "statistical discrepancy" that often plagued previous GDP releases.
6. Investment Momentum: Gross Fixed Capital Formation (GFCF), a proxy for investment, remained robust at 32 per cent of GDP.
data sources: MoSPI press note 27Feb2026 and author
Methodological improvements in compilation of GDP under Expenditure approach - India GDP New Series (base year 2022-23) - document released 27Feb2026
Methodological improvements in compilation of GDP under Production / Income approach - India GDP New Series (base year 2022-23) - document released 27Feb2026
Two charts below showing:
India Nominal GDP: FY 2025-26: Expenditure Approach and Its Components: GDP New Series (base year 2022-23) >
India Nominal GDP Measurement: FY 2025-26: Production Approach: GDP New Series (base year 2022-23) >
Charts 112 to 113 Click on the chart to view better >
What the two charts above reveal:
Expenditure Side Structure:
India’s Nominal GDP ( GDP new series, with base year 2022–23, for FY 2025–26) using the expenditure approach: Nominal GDP is Rs 345.47 lakh crore. The largest component is Private Final Consumption Expenditure (PFCE) at Rs 195.78 lakh crore, accounting for 56.7 per cent of GDP. This indicates that household consumption remains the primary driver of demand in the Indian economy.
Investment Dynamics:
Gross Fixed Capital Formation (GFCF) stands at Rs 109.44 lakh crore, contributing 31.7% of GDP, which reflects a strong investment share. When combined with changes in stocks (1.2%) and valuables (1.7%), total investment-related components exceed one-third of GDP. This suggests relatively solid capital formation, though still secondary to consumption-led growth.
Government Spending Role:
Government Final Consumption Expenditure (GFCE) is Rs 37.21 lakh crore, forming 10.8 per cent of GDP. This indicates a moderate fiscal consumption footprint compared to private consumption and investment. The government’s role is significant but not dominant in driving aggregate demand.
External Sector Position:
Exports are Rs 76.91 lakh crore (22.3% of GDP), while imports are higher at Rs 82.93 lakh crore (24.0% of GDP). This results in a negative net export contribution, implying a trade deficit that slightly drags on GDP. The economy is demand-driven domestically rather than export-led.
Statistical Discrepancy:
A small negative discrepancy of Rs - 1.04 lakh crore (-0.3% of GDP) exists. This is an adjustment between the production and expenditure methods of GDP estimation. The magnitude is minor relative to total GDP, indicating reasonable statistical consistency.
Production Side Structure:
On the production (GVA) side, total GVA at basic prices is 313.61 lakh crore. Adding net taxes on products (31.86 lakh crore) yields the same total nominal GDP of 345.47 lakh crore, ensuring internal consistency.
Sectoral Composition:
The tertiary (services) sector dominates with 54.4 per cent share in GVA or gross value added ( Rs 170.45 lakh crore). Within services, financial, real estate and professional services form the largest subcomponent at 27.0 per cent of GVA. Trade, hotels, transport and communication also contribute significantly (14.2%).
The secondary sector contributes 25.9 per cent of GVA (Rs 81.20 lakh crore), with manufacturing at 14.8 per cent and construction at 8.4 per cent. This indicates moderate industrial depth but continued reliance on services.
The primary sector contributes 19.8 per cenet of GVA (Rs 61.96 lakh crore), with agriculture forming the bulk (17.9%). This shows that agriculture still holds a notable share compared to more advanced economies, though it is no longer dominant.
Overall assessment:
India’s GDP structure reflects a services-led, consumption-driven economy. Domestic demand (especially private consumption) is the core engine. Investment levels are substantial but not yet dominant enough to signal a manufacturing-led transformation.
The services sector’s majority share suggests a structural shift typical of developing economies transitioning toward higher value-added activities, though manufacturing’s share indicates room for industrial expansion.
--------------------------------------------------------------
Update 10Feb2026: Charts 109 to 111:
Mutual Fund Assets: Growth of India Passive Equity Funds AUM:
Share of Total Equity AUM in Total Mutual Fund Industry AUM:
Mutual Fund net inflows: India Passive funds net inflows:
Complement this data with:
Update 12Jan2026 with Chart 100
Update 11Jan2026 with Charts 98 and 99
Update 11Jan2026 with Chart 97
Update 19Nov2025 with Chart 88
Update 19Nov2025 with Chart 87
Update 18Jul2025 with Chart 62
Update 17Jun2025 with Chart 50
Chart 1: Passive Equity AUM growth: Between
Mar2025 and Dec2025, total assets under management (AUM) of passive
equity funds (both ETFs as well as index funds) grew by Rs 1.76 lakh crore or 21 per cent -- the growth is
primarily driven by Indian stocks recovering from their Mar2025 lows.
In
the same period, the ETF asset growth is 19.2 per cent while that of
index funds is 28.3 per cent from a lower base. The share of ETFs in the total passive pie
is 78.4 per cent (see chart 1 below).
As of 31 Dec2025, the total number of equity ETF schemes are 231 and the number of index funds are 246, totaling 477.
The number of indices tracked by equity ETFs are 97, while that of index funds are 86.
data: NSE India passive funds - monthly data available
Chart 3: Share of Total Equity AUM in Total Industry: The share of total equity (including active and passive) AUM in total mutual fund industry has grown rapidly from about one-third in Mar2017 to about 57 per cent by Dec2025.
31Mar2017 (Rs lakh crore):
5.44 active equity
0.46 passive equity
5.89 total equity
33.6% share of equity in total MF industry
31Dec2025 (Rs lakh crore):
35.73 active equity
10.13 passive equity
45.86 total equity
57.2% share of equity in total MF industry
Five crisp reasons for the rise in equity’s share of total mutual fund industry AUM:
1. Strong Equity Market Performance: Sustained bull markets between 2017–2025 boosted equity valuations, increasing equity AUM faster than debt.
2. Shift in Retail Investor Preference: Growing financial literacy, the "search for yield" (investors shifting to higher-return -- often higher-risk -- assets like equities when returns on safer instruments such as deposits or bonds are low) and higher risk appetite led investors to prefer equity for long-term wealth creation over traditional fixed-income products.
3. Massive SIP Inflows: Record systematic investment plan (SIP) contributions provided steady, compounding inflows into equity funds.
4. EPFO Allocation to Equity ETFs: EPFO’s increasing allocation to equity ETFs significantly boosted passive equity AUM, raising equity’s overall share.
5. Tax & Regulatory Changes Impacting Debt: Changes in debt fund taxation, removal of indexation benefits and lower post-tax returns reduced the relative attractiveness of debt funds, indirectly increasing equity’s share.
Chart 2: Mutual Fund net inflows: India Passive funds net inflows: data include ETFs and Index funds for both equity and debt segments:
Net
inflows during the nine months of FY 2025-26 are Rs 0.73 lakh crore for ETFs
and Rs 0.15 lakh crore for index funds -- the data include equity and
debt segments (Nifty Indices does not provide break up of equity and
debt data).
Net inflows in nine months of 2025-26 seem to have slowed down due to higher redemptions in index funds.
In the past three years (FY 2022-23 to FY 2024-25), net inflows to ETFs and index funds were identical at Rs 1.71 lakh crore.
In the past five years (FY 2020-21 to FY 2024-25), net inflows to ETFs and index funds were at Rs 2.91 lakh crore and Rs 2.20 lakh crore respectively.
Read more:
Decoding the Nifty Midcap 150 Quality 50 Index: A Midcap Strategy Built on Fundamentals
Chart: India Passive Equity Funds AUM Growth (both ETFs and Index funds tracking BSE as well as NSE / Nifty equity indices)
Charts 109 to 111 Click on the chart to view better >
--------------------------------------------------------------
Update 09Feb2026: Charts 107 and 108:
India GST Collections: Goods and Services Tax: Gross GST revenue collections, refund data and net GST revenue collections (Blog: Is GST growth now tracking nominal GDP? and Tweet thread 01Jul2017 on GST):
Monthly collections:
Gross GST revenue collections in Jan2026 are Rs 1.93 lakh crores. Net GST revenue collections (net of
refunds) in the same month are 1.71 lakh crore, an improvement of 7.6 per cent over Jan2025 (Note: Jan2025 figures given in Jan2026 GST Collections report do not match with those given in Jan2025 GST Collections report -- no explanation for the difference is given by GST Council).
During Jan2026, the year or year (YoY) net GST collections growth rate improved to at 7.6 per cent
(versus Jan2025 data), compared to very low growth rate months between Sep2025 and Dec2025.
As can
be seen from the below chart, these YoY growth rates are volatile and
not much can be gleaned from the data.
One may have to see more granular data to analyse the monthly GST data.
For
the financial year 2025-26 (10 months till Jan2026), the net GST
collections are Rs 15.96 lakh crore, showing a YoY growth of 6.8 per cent
compared to Apr-Jan2025 period (see two charts below for data).
Average monthly Net GST Collections:
During FY 2025-26 (10 months data till Jan2026), the average monthly
net GST collections are Rs 1.60 lakh crore, compared to average monthly
figure of Rs 1.49 lakh crore for the correponding period of FY 2024-25 (see chart below).
Due
to inflationary pressures and other factors, average monthly net GST
collections improved from Rs 0.98 lakh crore for full FY 2018-19 to Rs
1.60 lakh crore now.
Net GST revenue equals gross GST revenue minus GST refunds. GST refund data prior to 2020-21 aren't available with GST Portal.
data sources:
India: Monthly Gross / Net GST Collections from Sep2024 to Oct2025:
Charts 107 and 108 click on them to view better >
--------------------------------------------------------------
Update 19Jan2026: Chart 106:
India PMS Industry AUM: India PMS Industry assets: PMS or portfolio management services (Check previous blog dated 09May2024 - Rapid Rise of India's PMS Industry - for a comprehensive analysis)
The industry's assets under management (AUM) as on 30Nov2025 are Rs 41 lakh crore including those from EPFO / other PFs (check update 19Jun2025 with charts 51 to 55 below for EPFO data).
India’s PMS industry has expanded steadily over the last decade, with total assets under management rising from about Rs 7 lakh crore in Mar2015 to Rs 41 lakh crore by Nov2025.
This represents nearly a six-fold increase in AUM over ten years.
A major portion of the increase in PMS assets is driven by EPFO investments routed through equity ETFs since Aug2015.
It may be noted EPFO investments in Equity ETFs are shown under EPFO / PFs column of the SEBI data; not under Listed Equity column in the chart below.
So, Listed Equity category assets do not include EPFO investments in Equity ETFs or exchange traded funds. As such, the listed equity numbers understate the true equity exposure under the PMS.
The number of PMS clients has grown from 46,700 in Mar2015 to 2.11 lakh by Nov2025, more than a four-fold increase.
A portfolio manager basically manages money in two routes, namely, discretionary and non-discretionary basis. The data presented here include money under both the routes.
In a discretionary portfolio, a portfolio manager enjoys full discretion to manage clients' funds. However, in case of a non-discretionary portfolio, a portfolio manager does not have any discretion to invest a client’s money.
Chart showing AUM of PMS industry, number of portfolio managers and number of clients >
Chart 105 click on the image to view better >
--------------------------------------------------------------
Update 16Jan2026: Chart 105:
AMFI List: Classification of Indian stocks by market capitalisation: To be followed by Equity Mutual Funds or EMFs (previous blog dated 17Feb2024 / Tweet thread 05Jan2023)
SEBI's Oct2017 definition of stocks on the basis of their
market capitalisation is as follows:
1) large-cap stocks: 1st to 100th company in terms of full market capitalisation
2) mid-cap stocks: 101st to 250th company in terms of full market capitalisation
3) small-cap stocks: 251st company onwards in terms of full market capitalisation
According to SEBI definition, Association of Mutual Funds in India (AMFI) prepares a
list of all listed stocks (more than 5,000 in number) based on their
average market capitalisation and publishes the list of large-, mid- and
small-cap stocks.
AMFI
prepares the list two times in a year, that is, at the end of June and
December of every year.
The below chart provides data as published by AMFI for the half-yearly period (based on average market capitalization of stocks during Jul-Dec2025) ended 31Dec2025.
As on 31Dec2025:
Large-cap stocks: Stocks with market cap of more than Rs 105,000 crore
Mid-cap stocks: Stocks with market cap of more than Rs 34,700 crore, but less than Rs 105,000 crore
Small-cap stocks: All stocks with market cap of less than Rs 34,700 crore
Percentage change in market cap is modest in the past one year.
Changes in market cap in the past one year:
5.0% large-cap
5.2% mid-cap
But market cap expansions are more than 100 per cent in the past three years.
Changes in market cap in the past three years:
115% large-cap
107% mid-cap
This means, a stock with more than Rs 16,800 crore, but less than Rs 48,800 crore market cap was considered a mid-cap stock three years ago; but now the market cap range for a mid-cap stock has more than doubled to Rs 34,700-105,000 crore -- as Indian stocks provided stellar returns in the past three years.
Chart: Snapshot of AMFI classification of stocks by market cap: Data from Dec2022 to Dec2025:
Chart 105 click on the image to view better >
--------------------------------------------------------------
Update 16Jan2026: Chart 104:
India Real interest rates: (old blog
dated 05Aug2021) >
Real
interest rate in India for the month of Dec2025 declined to 3.9 per cent
from 4.8 per cent in Nov2025, as
India's CPI
inflation for Dec2025 ticked up slightly to 1.3 per cent -- though price rise guage overall is on a downward trajectory.
In fact, Oct2025 print of 5.3 per cent for real interest rate is the highest for several years.
The past 15-month data in the chart given below suggest the real rate cycle is inflation-led, not policy-rate-led.
Real interest rate equals LAF repo rate minus CPI inflation.
If
you believe the official CPI figures dished out by Govt of India,
Indian savers have been enjoying highh real interest rates since May2025,
while RBI has been reducing interest rates aggressively as India's CPI
inflation touched almost zero levels in Oct2025.
Term deposit rates average 6.22 per cent, even as inflation is below one per cent.
Inflation collapse is doing the heavy lifting for high real rates.
As argued earlier, high real interest rates usually slow economic growth by raising the true cost of borrowing and discouraging investment.
Dichotomy between sticky G-Sec yields while rates are falling:
Over the last 15 months, the RBI cut the repo rate by 125 basis points and CRR (cash reserve ratio) by 100 basis points (check Update 13Jan2026, with Charts 101 and 102 below), but the 10-year government bond yield barely moved, staying in a narrow range.
India
10-year benchmark G-Sec yield hovers around 6.3 to 6.7 per cent in the
past six months, though RBI has injected massive amounts of liquidity in
to the banking system (OMO purchases and USD INR swaps) in addition cutting repo rates aggressively and undertaking CRR rate cuts too.
This shows that long-term bond markets are not guided by short-term policy cuts or monthly inflation prints.
Instead, they reflect expectations about medium-term inflation returning closer to RBI target, along with India’s long-run growth and fiscal borrowing needs.
Investors appear unconvinced that today’s low inflation and high real rates will last. As a result, long-term yields remain “sticky” even while short-term rates fall sharply.
Bond markets may also be worried about large government borrowing, which keeps bond supply high and pushes yields up. Fiscal concerns raise term premia and inflation risks over time, making long-term yields sticky despite repo rate cuts.
MCLR rate and monetary policy transmission:
One
more column is added with data pertaining to MCLR (1 year) or marginal cost of
funds based lending rate.
By placing MCLR 1-year rate alongside repo, inflation and G-Sec yields, the chart allows a reader to see how much of the RBI policy stance actually reaches borrowers (monetary policy transmission).
The slow and partial decline in MCLR versus repo cuts highlights transmission delay. Slower MCLR decline shows that banks are not easing lending rates in proportion to repo rate cuts.
CPI
inflation, average 1-year bank term deposit rates and India 10-year
G-Sec yield data too have been included in the below chart for
comparison purposes.
Check Update 13Jan2026 with charts 101 and 102 below to know more about MCLR overnight rate versus MCLR 1-year rate.
Check Update 13Jan2026 with chart 103 below to know more about EBLR and MCLR mix overall rupee floating rate loans outstanding.
See Tweet thread 27Dec2025 for internal benchmark lending rates and external benchmark lending rates (EBLRs).
Chart 104 click on the image to view better >
--------------------------------------------------------------
Update 13Jan2026: Chart 103:
Lending Rates of Banks in India : (Reference: Tweet thread dated 27Dec2025)
India's banking regulator RBI introduced External Benchmark Based Lending in Sep2019, making it mandatory for all new floating rate personal or retail loans and floating rate loans to Micro and Small Enterprises (MSMEs).
Since then, Banks in India have been offering personal or retail loans (like housing, auto and others) and MSME loans based on external benchmark lending rates (EBLR).
External benchmarks of banks in India (approved by RBI):
1. RBI LAF policy repo rate
2. 91-day Treasury bill yield published by FBIL
3. 182-day Treasury bill yield published by FBIL
4. Any other benchmark market interest rate published by FBIL
FBIL is Financial Benchmarks India Pvt Ltd, a financial benchmark setter supervised by RBI.
Internal benchmark interest rates, like, base rate and BPLR have largely become irrelevant now -- with banks lending only a tiny portion of their total outstanding loans through base rate and BPLR.
As per RBI data, the share of total outstanding floating rate rupee loans (of 74 SCBs in India) as of 30Sep2025 is:
64.8% EBLR or external benchmark-based lending rate
32.2% MCLR or marginal cost of funds based lending rate
3.0% Others (include BPLR or benchmark prime lending rate and Base rate)
As shown here, the lion's share of bank lending in India is linked to EBLRs (which is good for monetary policy transmission or MPT).
One-third of total loans outstanding is linked to MCLR. Most of the corporate loans and a small portion of retail loans are linked to MCLR.
In the context of monetary policy transmission (MPT), the relevance of external benchmark lending rates (EBLRs) is:
1. EBLRs ensure RBI policy changes reach borrowers immediately by linking loan rates directly to market benchmarks instead of internal bank costs.
2. With mandatory three-month resets, EBLRs remove the delays seen under MCLR.
3. Repo Rate changes now quickly and directly affect borrowing costs across most of the lending market.
Pass-through of RBI policy rates is quicker now with almost two-thirds of bank lending is linked to external benchmark rates.
Using benchmarks like the Repo rate or Treasury bill yields enables quarterly resets and direct monetary policy transmission (MPT).
Kudos to RBI! 👍
Monetary policy transmission is slower under MCLR because most loans reset only annually, delaying the pass-through of RBI rate changes.
Indian banks depend largely on deposits rather than RBI borrowing. And deposit rates are sticky downward, so funding costs fall slowly.
Banks also have discretion with MCLR and tend to pass on rate hikes faster than cuts to protect margins.
So, lending rates adjust with a lag, which is why RBI in 2019 nudged banks to shift to external benchmarks for faster transmission.
Chart showing data on share of EBLR and MCLR in outstanding bank loans >
Data: RBI press release 31Dec25 on Lending and Deposit Rates of SCBs
What the data in the above chart show at a glance:
The data show a steady and structural shift in India’s banking system from MCLR-linked lending to external benchmark–linked rate (EBLR) lending. The data are for 74 SCBs in India.
Over six years, EBLR’s share has risen from just 5.2 per cent in Dec2019 to 64.8 per cent by Sep2025, while MCLR’s share has fallen correspondingly from over 80 per cent to just above 32 per cent.
Pace and timing of the transition:
The transition accelerates sharply after 2021, reflecting regulatory push by the RBI to improve transparency and monetary policy transmission.
The most rapid gains for EBLR occur between Dec2020 and Dec2023, when its share more than doubles, indicating banks actively migrated new loans—and some existing ones—toward externally benchmarked pricing.
Implications for monetary transmission:
A higher EBLR share means policy rate changes transmit faster and more directly to borrowers. Unlike MCLR, which depends on banks’ internal cost of funds, EBLR adjusts almost automatically with repo rate changes.
This explains why recent repo rate cuts have shown quicker impact on new floating-rate loans, even though overall WALR transmission (see Update 13Jan2026 with Charts 101 and 102 below) remains partial.
Why MCLR still matters:
Despite the decline, MCLR-linked loans still account for nearly one-third of outstanding floating-rate loans. This legacy stock is a key reason aggregate lending rates remain sticky despite policy easing.
Structural takeaway
The data confirm a durable shift toward a more policy-sensitive lending framework in India. However, until MCLR-linked loans shrink further and deposit-side rigidities ease, monetary transmission will remain faster than in the past—but still weak.
--------------------------------------------------------------
Update 13Jan2026: Charts 101 and 102:
How Rates and Ratios are Moving : (previous blog dated 26May2022)
The
following charts provides data on key interest rates and ratios of
interest rate market in India. The rates and ratios range from CPI
inflation, Policy repo rate, lending and deposit rates, short-term rates
such as call money and Treasury bill yields, long term bond yields and
government-administered small savings rates of PPF, NSC and post office
deposit rates.
By looking at data over medium and long periods, one can glean some insights.
Two charts:
Quarterly data (Dec2023 to Dec2025) of rates and ratios
Yearly data (Dec2018 to Dec2025).
Please click on the charts to view better >
What the above two charts reveal >
Quarterly chart:
The quarterly data highlights short-term momentum and turning points rather than long-cycle trends. Between Dec2024 and Dec2025, the most striking development is the rapid collapse in inflation, with CPI falling from above 5 per cent to near 1.3 per cent and WPI slipping into negative territory.
This disinflation is much faster than changes in policy rates, showing that prices are cooling much faster than the central bank is reducing nominal interest rates. This is contributing to higher real interest rates, which makes borrowing more expensive in inflation-adjusted terms leading to tighter financial conditions.
Monetary policy stance and liquidity conditions:
Liquidity conditions are clearly easing. CRR cuts from 4.0 per cent to 3.0 per cent release durable liquidity into the system, and this is reflected first in money-market instruments. Policy repo rate has been cut by 125 basis points (one percentage point equals 100 basis points) in the past one year.
Money market and short-term yields:
Call money rates and Treasury bill yields fall across in the past one year, confirming surplus liquidity and lower short-term rate expectations. The short end of the curve reacts quickly, indicating confidence that the easing cycle is not a one-off move.
There
have been no changes in interest rates of Post Office savings schemes (NSC, PPF, post
office term deposit rates, etc.) in the past two years. It is not clear
why Govt of India has not been changing these interest rates as per the
market rates.
Bank lending and borrowing conditions:
Transmission to bank lending is slower. Weighted average lending rate (WALR) of scheduled commercial banks (SCBs) and Marginal cost-of-funds lending rate (MCLR) decline only gradually and remain sticky despite repo cuts.
In 2025: while the RBI's policy repo rate fell sharply by 125 basis points, the WALR declined only 65 basis points -- clearly exhibiting weak policy transmission in India. In effect, banks passed through barely half of that cut to borrowers.
This quarterly stickiness suggests banks are prioritising balance-sheet strength and risk pricing. In the near term, borrowers benefit more from capital market yields than from bank lending rates.
Real interest rates rise sharply on a quarterly basis because inflation falls faster than nominal rates. This makes each quarter of 2025 progressively more restrictive in real terms, even though headline policy signals suggest easing.
The quarterly picture therefore shows a paradox: easing liquidity and falling yields alongside tightening real financial conditions.
Deposit growth has lagged credit growth in the past one year, forcing banks to compete aggressively for term deposits. Because small savings schemes and debt funds offer attractive alternatives, banks cannot cut deposit rates sharply without risking outflows.
As a result, banks’ cost of funds remains high, keeping MCLR and WALR sticky. Even when the repo rate is cut, banks are reluctant to pass it on fully to borrowers.
Improved system liquidity from CRR cuts, OMO purchases and forex swaps do not solve this structural deposit scarcity.
Hence, difficulty in attracting deposits is a key reason lending rates have not fallen meaningfully in the past one year.
Observations from movement in 8-year data between Dec2018 to Dec2025:
The yearly data tells a structural story of regime change rather than short-term adjustments. From 2019 to 2022, India experienced elevated inflation volatility and periods of deeply negative real interest rates, especially during and after the COVID-19 pandemic.
This era was characterised by accommodative policy, low repo rates and inflation spikes that eroded Indian savers’ returns.
From 2023 onward, the trend reverses decisively. Inflation moderates, policy rates peak and by 2025 the system shifts into a high real interest rate regime. Real rates move from negative in 2020–2022 to strongly positive in 2024–2025, marking a clear break from the post-pandemic monetary framework.
This indicates restored inflation control and better central bank credibility.
Yearly bond yields show a gradual but persistent decline rather than sharp swings. The 10-year G-Sec yield falls from above 7.2 per cent in 2023 to around 6.65 per cent in 2025, signaling long-term confidence in lower inflation, even as fiscal supply remains a constraint.
Unlike quarterly volatility, the yearly view confirms that yields are normalising, not collapsing.
Govt of India's small savings instruments have been structurally rigid in the yearly data. NSC and PPF rates barely change across years, which means their attractiveness rises sharply when inflation falls.
Over the long run, this creates a sustained incentive for household financial savings, potentially diverting funds away from risk assets.
Overall, the yearly chart shows India transitioning from a growth-support, inflation-tolerant regime to a stability-focused regime with positive real returns.
It's worth repeating that liquid fund returns are market-determined; but not savings bank
(SB) interest rates and government's small savings rates.
Bonus tip:
Overnight MCLR rate versus One-year MCLR rate:
Overnight MCLR applies mainly to very short-term loans, while 1-year MCLR benchmarks common retail products like home loans.
MCLR, or Marginal Cost of Funds based Lending Rate, is a benchmark set by banks under RBI guidelines for setting loan interest rates. Banks publish rates for tenors including overnight, 1-month, 3-month, 6-month, 1-year, 2-year and 3-year.
Overnight MCLR applies to very short-term loans lasting one day, such as emergency credit or interbank dealings. It reflects immediate funding costs but has limited relevance for typical retail borrowers.
MCLR overnight is used mostly by bank treasury departments. It's primarily used for interbank transactions, institutional lending or specific corporate credit lines that need to be settled in 24 hours.
The 1-year MCLR serves as the most popular benchmark for home loans and other long-term retail lending products. Most floating-rate retail loans taken between Apr2016 and Sep2019 (like home loans) are linked to the 1-year MCLR.
Even if a bank changes its MCLR every month, your specific loan interest rate usually only changes once a year on your reset date, based on the 1-year MCLR prevailing at that time.
Data:
Tweet thread 27Dec2025 - bank lending rates in India (EBLR vs MCLR) EBLR - external benchmark-based lending rate
(Note: Base rate system of loan pricing becomes irrelevant now, with less than 2% bank loans priced via base rate)
RBI press release 31Dec2025 - deposit and lending rates of SCBs --------------------------------------------------------------
Update 12Jan2026: Chart 100:
Mutual Fund Assets: Fund-wise MF AUM data: Top 20 AMC-Wise MF AUM data: Average AUM or AAUM data:
Complement this data with:
Update 11Jan2026 with Charts 98 and 99
Update 11Jan2026 with Chart 97
Update 19Nov2025 with Chart 88
Update 19Nov2025 with Chart 87
Update 18Jul2025 with Chart 62
Update 17Jun2025 with Chart 50
Chart showing Top 20 Fund-wise Average AUM data for the quarter ending 31Dec2025 >
What the above chart reveals >
The total AAUM (average assets under management) of India's mutual fund industryis Rs 81 lakh crore for the Oct-Dec2025 quarter ending 31Dec2025.
The chart shows top 20 fund houses, their average AUM and their share in the total average AUM.
The data cover 51 AMCs (asset management companies) in total, though the table displays the top 20 fund houses.
The industry remains meaningfully concentrated among the largest fund houses. SBI Mutual Fund leads with Rs 12.49 lakh crore AAUM and a 15.4 per cent market share.
ICICI Prudential and HDFC follow with 13.3 per cent and 11.4 per cent respectively. The top three together account for roughly 40 per cent of total industry AAUM, indicating strong scale advantages and Bank-led AMC dominance at the very top.
The insane concentration is as follows:
55.8% top 5 fund houses
76.2% top 10
86.9% top 15
94.5% top 20
This leaves just 5.5 per cent of AAUM spread across the remaining 31 AMCs.
The cumulative AUM shares underline a highly concentrated industry structure.
The numbers strongly show the Pareto principle at work. A small fraction of AMCs controls a disproportionately large share of industry assets, which is the classic 80/20 dynamic.
Bank-led Fund Houses Dominate:
Bank-sponsored AMCs clearly dominate the landscape. SBI, ICICI Prudential, HDFC, Kotak, Axis, Canara Robeco and Bandhan together account for a large portion of the cumulative share.
Bank-sponsored AMCs benefit from captive distribution via branch networks, long-standing customer relationships and preferential access to retail and institutional flows.
Salary accounts, corporate banking relationships and branch-driven sales create a steady pipeline of assets that smaller, non-bank AMCs cannot easily replicate.
Non-bank and independent fund houses are largely competing within a narrow slice of the remaining market.
Even successful players like Nippon India, Aditya Birla Sun Life and Mirae Asset operate in an environment where incremental growth requires either differentiated performance, niche product leadership or aggressive digital and intermediary-led distribution.
The data reinforces that the Indian mutual fund industry is not just concentrated, but structurally tilted in favour of bank-led AMCs.
Scale, distribution, and legacy banking relationships matter more than marginal performance differences, especially when viewed through average AUM rather than point-in-time assets.
One may say return performance alone is very unlikely to be the primary reason for bank-led AMC dominance.
The 11 bank-led AMCs together command 58.5 per cent of total industry AAUM, even though they represent only about 22 per cent of all AMCs (11 out of 51).
This dominance suggests that the Indian mutual fund industry is not just concentrated by size, but also by sponsor type. Bank ownership acts as a powerful moat, reinforcing the Pareto distribution and making market share gains by independent AMCs inherently more difficult.
Explanation: Why is the average AUM figure of Rs 81 lakh crore differs from Rs 80.23 lakh crore AUM figure (see update 11Jan2026 with charts 98 and 99 below)?
The higher figure (Rs 81.01 lakh crore) is a three-month average that reflects how much money was in the system during the overall quarter, including when the markets were peaking.
The lower figure (Rs 80.23 lakh crore) is a single snapshot of the very last day of the calendar year 2025, which is always skewed by a temporary outflows in the last month of a quarter.
Essentially, the average shows the general health of the quarter, while the closing figure shows the temporary effect of tax outgo by cororates. AMFI does not provide ready-data for AUM by AMC-wise as at the end of a month / quarter.
Data: Average AUM data (fund-wise) of AMFI
--------------------------------------------------------------
Update 11Jan2026: Charts 98 and 99:
Mutual Fund Assets: Growth of India Mutual Fund Industry: Mutual Fund AUM data (For a detailed analysis, please refer to the blog dated 18Jul2024)
In
the 2025-26 financial year (9-month data), India's mutual fund industry experienced an
impressive 22 per cent growth in assets under management (AUM), as per AMFI data. The growth rate for full FY 2025-26 is likely to surpass that of FY 2024-25 growth.
The
industry's total assets surged from Rs 65.74 lakh crore on 31Mar2025 to
Rs 80.23 lakh crore by 31Dec2025, reflecting robust investor
participation and growing confidence in mutual funds as an investment
vehicle.
In comparison, the aggregate deposits of India's scheduled commercial banks (SCBs) as on 31Dec2025 are Rs 248.6 lakh crore.
Two charts:
Growth from 2000 to 2012 >
Growth from 2013 to 2025 >
--------------------------------------------------------------
Update 11Jan2026: Chart 97:
Mutual Fund Assets: India Passive Funds AUM Data: Passive Funds asset size (ETFs and Index funds of equity, debt and commodities): MF AUM data:
Complement this data with:
Update 19Nov2025 with Chart 88
Update 19Nov2025 with Chart 87
Update 18Jul2025 with Chart 62
Update 17Jun2025 with Chart 50
As of 31Dec2025,
total passive funds' AUM (assets under management) in India is Rs 14.21 lakh crore -- covering all ETFs (exchange trade funds) and index funds
across Equity, Debt and Commodities. Commodities include gold and
silver.
Break up of the total passive funds' AUM is as follows:
Asset-wise split:
Equity Passive Funds (ETFs + Index funds):
Equity
is the largest component of passive investing in India. Total equity
passive AUM is Rs 10.12 lakh crore, accounting for roughly three-fourths
of all passive assets.
This shows that equity ETFs are the primary driver of passive fund growth in India.
Within equity:
ETFs hold Rs 7.95 lakh crore.
Index funds hold Rs 2.17 lakh crore.
Debt Passive Funds (ETFs + Index funds):
Total debt passive AUM is Rs 2.04 lakh crore.
Within debt:
ETFs account for Rs 0.99 lakh crore.
Index funds account for Rs 1.05 lakh crore.
Debt index funds slightly exceed debt ETFs, indicating growing investor comfort with index-based debt products.
Commodities Passive Funds (Only ETFs):
Total commodity passive AUM is Rs 2.01 lakh crore, showing a sharp increase in recent months, as gold and silver prices have soared sharply.
The entire commodity exposure comes through ETFs.
Commodity ETFs include gold and silver ETFs. Gold ETFs form the bulk of this category. There are not commodity index funds.
ETF vs Index Fund Comparison:
As on 31Dec2025, total ETF AUM is Rs 10.95 lakh crore, bulk of which is from equity.
ETFs make up about three-fourths of the total passive fund market.
Total index fund AUM is Rs 3.26 lakh crore, majority is from equity segment.
Index funds account for about one-fourth of total passive assets.
Key Observations:
> Passive investing in India is strongly equity-led
> ETFs dominate the passive fund landscape, especially in equity and commodities
> Debt index funds are growing and have slightly overtaken debt ETFs
> Commodity passive investing remains ETF-centric, suggesting scope for new product development.
data: NSE India passive funds - monthly data available Chart 97 click on the image to view better >
--------------------------------------------------------------
Update 28Dec2025: Chart 96:
India CPI Inflation : India Cumulative Inflation: India consumer price inflation data:
The
following chart shows: cumulative CPI inflation numbers for the
past 10, five and three years,
The
cumulative data will give you a new perspective on how much consumers
have suffered over the years, instead of just looking at one-year
numbers.
The
data shown in the chart are for the past 15 months -- cumulative data
for 10, 5 and 3 years are given. Year-on-year CPI inflation is also
included in the chart.
CPI
inflation has been falling continuously for the past one year --
falling from a high of 6.2 per cent in Oct2024 to 0.7 per cent in Nov2025 (In fact, the Oct2025 print of 0.3 percent is the lowest for several years).
But
if you compare the cumulative inflation, it clearly shows Indian
consumers still face long term price pressures -- as indicated by 3-year
cumulative price rise of 12.1 per cent and 5-year cumulative price rise
of 24.5 per cent and 10-year cumulative inflation of 56.3 per cent as at the end of Nov2025.
Why “Low Inflation” Doesn’t Feel Low?
You may see headlines saying inflation is just 0.7 per cent this year. Yet most people feel that daily expenses are still high. That confusion is natural, and it comes from how inflation is usually explained.
Inflation Speed vs Inflation Distance
One-year inflation only tells us how much prices have risen compared to last year. It shows the current pace of price increases, not the total rise over time. Think of it like speed versus distance. Slowing down does not take you back to where you started.
The Missing Picture: Cumulative Price Rise
When we look at cumulative inflation, prices today are about 12 per cent higher than three years ago, roughly 25 per cent higher than five years ago, and over 56 per cent higher than ten years ago. This is what households actually experience in food, rent, education and healthcare.
Why Prices Still Feel High
Even if inflation falls to zero (provided you believe in the official inflation data put out by the governments), prices do not come down. They simply stop rising. People are still living with years of accumulated price increases, while incomes often lag behind.
The Bottom Line
Low inflation is helpful because it prevents further damage. But it does not erase past price rises. To understand the real cost of living, we must look beyond one-year inflation and acknowledge the cumulative loss of purchasing power.
Tweet thread on joke about cryogenic chamber and cumulative inflation
Data sources:
Chart 96 click on the image to view better >
--------------------------------------------------------------
Update 28Dec2025: Chart 95:
Mutual Fund Assets: India Passive Funds AUM Data: Passive Funds asset size (ETFs and Index funds of equity, debt and commodities):
Complement this data with:
Update 19Nov2025 with Chart 88
Update 19Nov2025 with Chart 87
Update 18Jul2025 with Chart 62
Update 17Jun2025 with Chart 50
As of 30Nov2025, total passive funds' AUM (assets under management) in India is Rs 13.72 lakh crore -- covering all ETFs (exchange trade funds) and index funds across Equity, Debt and Commodities. Commodities including gold and silver.
Break up of the total passive funds' AUM is as follows:
Asset-wise split:
Equity Passive Funds (ETFs + Index funds):
Equity is the largest component of passive investing in India. Total equity passive AUM is Rs 10.03 lakh crore, accounting for roughly three-fourths of all passive assets.
This shows that equity ETFs are the primary driver of passive fund growth in India.
Within equity:
ETFs hold Rs 7.88 lakh crore.
Index funds hold Rs 2.15 lakh crore.
Debt Passive Funds (ETFs + Index funds):
Total debt passive AUM is Rs 2.05 lakh crore.
Within debt:
ETFs account for Rs 0.99 lakh crore.
Index funds account for Rs 1.06 lakh crore.
Debt index funds slightly exceed debt ETFs, indicating growing investor comfort with index-based debt products.
Commodities Passive Funds (Only ETFs):
Total commodity passive AUM is Rs 1.60 lakh crore.
The entire commodity exposure comes through ETFs.
Commodity ETFs include gold and silver ETFs. Gold ETFs form the bulk of this category. There are not commodity index funds.
ETF vs Index Fund Comparison:
As on 30Nov2025, total ETF AUM is Rs 10.47 lakh crore, bulk of which is from equity.
ETFs make up about three-fourths of the total passive fund market.
Total index fund AUM is Rs 3.25 lakh crore, majority is from equity segment.
Index funds account for about one-fourth of total passive assets.
Key Observations:
> Passive investing in India is strongly equity-led
> ETFs dominate the passive fund landscape, especially in equity and commodities
> Debt index funds are growing and have slightly overtaken debt ETFs
> Commodity passive investing remains ETF-centric, suggesting scope for new product development.
data: NSE India passive funds - monthly data available Chart 95 click on the image to view better >
--------------------------------------------------------------
Update 28Dec2025:
Look for Update dated 28Dec2025: Gold and silver prices hitting all time highs (ATH) in Dec2025 in my blog 'Who is Eating My Gold ETF Return? 25Jan2022
--------------------------------------------------------------
Update 27Dec2025: Chart 94:
India Real interest rates: (old blog
dated 05Aug2021) >
Real
interest rate in India for the month of Nov2025 declined to 4.8 per cent
from 5.3 per cent in Oct2025, as
India's CPI
inflation is on a downward trajectory (Oct2025 print for real interest rate is the highest for several years).
Real interest rate equals LAF repo rate minus CPI inflation.
If you believe the official CPI figures dished out by Govt of India, Indian savers have been enjoying high real interest rates since May2025, while RBI has been reducing interest rates aggressively as India's CPI inflation toughed almost zero levels in Oct2025.
Term deposit rates average 6.22 per cent, even as inflation is below one percent.
India 10-year benchmark G-Sec yield hovers around 6.3 to 6.6 per cent in the past six months, though RBI has injected massive amounts of liquidity in to the banking system (OMO purchases and USD INR swaps) in addition cutting repo rates aggressively and undertaking CRR (cash reserve ratio) rate cut too.
Inflation collapse is doing the heavy lifting for high real rates.
What Global Experience Tells Us About High Real Interest Rates
1. High real interest rates usually slow economic growth by raising the true cost of borrowing and discouraging investment.
2. Consumers tend to spend less and save more, especially on big-ticket items like homes and vehicles.
3. Asset prices such as equities and real estate typically weaken as valuations compress and demand falls.
4. Financial stress rises over time, particularly for highly leveraged firms and emerging economies.
5. If high real rates persist, inflation often undershoots and central banks eventually cut rates to revive growth.
CPI
inflation, average 1-year bank term deposit rates and India 10-year
G-Sec yield data too have been included in the below chart for
comparison purposes.
One more column is added with data pertaining to MCLR or marginal cost of funds based lending rate, so that readers can discern whether banks are reducing their lending rates when RBI reduces its policy Repo rate.
See Tweet thread 27Dec2025 for internal benchmark lending rates and external benchmark lending rates (EBLRs).
Data sources are Reserve Bank of India, MOSPI, CCIL India and author.
Chart 94 click on the image to view better >
--------------------------------------------------------------
Update 07Dec2025: Chart 93:
India CPI Inflation : India Cumulative Inflation: India consumer price inflation data:
The
following chart shows: cumulative CPI inflation numbers for the
past 10, five and three years,
The
cumulative data will give you a new perspective on how much consumers
have suffered over the years, instead of just looking at one-year
numbers.
The
data shown in the chart are for the past 15 months -- cumulative data
for 10, 5 and 3 years are given. Year-on-year CPI inflation is also
included in the chart.
CPI inflation has been falling continuously for the past one year -- falling from a high of 6.2 per cent in Oct2024 to just 0.3 per cent in Oct2025. In fact, the Oct2025 print is the lowest for several years.
But
if you compare the cumulative inflation, it clearly shows Indian
consumers still face long term price pressures -- as indicated by 3-year
cumulative price rise of 11.7 per cent and 5-year cumulative price rise
of 24.6 per cent and 10-year cumulative inflation of 56.5 per cent as at the end of Oct2025.
Data sources:
--------------------------------------------------------------
Update 02Dec2025: Chart 92:
QIP funds raised by India Inc: (Tweet thread 16Dec2024):
Data from FY 2006-07 to FY 2025-26 >
During
the financial year 2025-26 (data for 8 months till 30Nov2025), India
Inc raised funds worth Rs 47,500 crore via QIPs or qualified
institutional placements (equity capital).
The Indian media kept highlighting that QIP fundraising had been the “highest in 19 years” up to March 2025. Yet in the first eight months of FY 2025-26, India Inc has raised only about Rs 47,500 crore through QIPs—a clear slowdown. Strangely, this shift has gone largely unreported.
The chart below adjusts QIP mobilisation for the average BSE market capitalisation of all listed companies in India. Once you look at the numbers in relative terms, the picture changes sharply.
In FY 2025-26 (till 30 Nov 2025), funds raised via QIPs amount to just 0.11 per cent of the average BSE market cap.
For comparison, the figure for the full FY 2024-25 was 0.33 per cent. Even number of issues are only 21 this year versus 85 in 2024-25.
In the past 20 years, the biggest QIP raised is in FY 2009-10,
when QIP raised was 0.91 per cent of the average market cap for the
financial year. Media will give only the absolute numbers, without
adjusting with other metrics, like, market cap -- in the process, the
data lose relevance and may lead to misinterpretation.
As
data from FY 2006-07 to 2024-25 show: In 2009-10, 2007-08, 2020-21
& others, QIP as a percentage of BSE market cap is much higher
compared to FY 2023-24 and 2024-25.
For
example, in FY 2009-10, India Inc raised QIP of Rs 41,968 crore (0.91
per cent of market cap) when the average BSE market cap was just Rs
46.26 lakh crore. Whereas, QIP raised was Rs 62,520 crore (just 0.47 per
cent of market cap) in 2017-18 when average BSE market cap was Rs
131.90 lakh crore -- though absolute QIP number is higher.
Take
another example: in both FY 2014-15 & 2021-22, the QIP raised is
nearly the same at Rs 28,500 crore.
But in 2014-15, the Sensex and BSE market cap are much lower -- hence,
the amount raised is nearly three times in 2014-15, when compared to
2021-22.
Don't believe the nonsense of absolute numbers.
Yet this context is almost always missing in media coverage. Reports highlight absolute fundraising totals but rarely adjust for market size or provide year-wise comparisons that show whether the activity is actually strong, weak or average.
The takeaway: absolute numbers can mislead.
Just because data points are available—and repeated in headlines—doesn’t mean they tell the full story. Always question the context, look at ratios and do your own research.
Data sources:
See BSE Ltd weblink for QIP issuers.
Chart 92 Click on the chart to view better >
--------------------------------------------------------------
Update 02Dec2025: Chart 91:
India GDP quarterly growth rates: Real GDP and Nominal GDP Growth Rates %: Data from Apr-Jun2023 to Jul-Sep2025 Quarter:
For
the Jul-Sep2025 quarter, India real GDP clocked a year-on-year (yoy)
growth rate of 8.2 per cent, the highest in the past six quarters.
However, the nominal GDP growth rate (yoy) slumped to 8.3 per cent, the
lowest in four quarters.
In fact, nominal GDP has been decelerating for the past two quarters: it decreased from Rs 88.18 lakh crore in Jan-Mar2025 quarter to Rs 86.05 lakh crore in Apr-Jun2025 quarter and further to Rs 85.25 lakh crore in Jul-Sep2025 quarter.
The second quarter real GDP growth is driven by: manufacturing (9.1%) and construction (7.2%) in the Secondary Sector; and financial, real estate and professional services (10.2%) in the Tertiary Sector.
However, Agriculture sector grew by just 3.5 per cent.
For
the past four quarters (Oct2024-Sep2025), India's real GDP is Rs 195.14
lakh crore, while the nominal GDP is Rs 344.5 lakh crore in the same
period.
India market cap-GDP ratio:
As of today, that is 02Dec2025, the market cap of all BSE companies is
Rs 472.51 lakh crore (or USD 5.26 trillion). The market cap to GDP ratio, based on the Oct2024-Sep2025 nominal GDP of Rs 344.5 lakh crore (USD 3.83 trillion), works out to 137 per cent, which is high by
historical standards.
India follows an April to March financial year.
Data Accurancy problems in India and IMF has given India GDP data a 'C' grade (second lowest) >
Pronab Sen, former India's chief statistician talking to Karan Thapar of The Wire on 29Nov2025:
> IMF is casting doubts on data accuracy of Indian government's GDP data
> IMF has recently India 'C' grade (the second lowest) for GDP data
> IMF is concerned there is wide gap between production and expenditures methods of GDP calculation
> India does not have PPI or Producer Price Index
> PPI data will be different from CPI data
> Data on prices (using CPI data) while calculating GDP estimates are problematic
> The problem lies with lack of PPI Index in India
> India Inc is not sharing actual data with Indian govt, which does not want to force India Inc to share data
> India Inc considers the PPI data confidential, hence they are reluctant to share it with Govt
> India was supposed to revise its CPI data and GDP base year every five years; but Govt has not been doing it -- hence, the IMF finds problems with India GDP data accuracy
> CPI basket of goods are services is outdated (2011-12 base year); what we actually consume now is not represented in the outdated CPI basket of itmes we use currently > Outdated CPI basket means you're are not capturing the goods / services that are in demand today
> As such, India official GDP data are less than reliable
> GDP deflator (nominal GDP minus real GDP growth) is just 0.5 per cent, which is too low to believe
> Hard Quarterly GDP is not available; hence NSO / MOSPSI uses proxy data
> actual GDP data is available only annually (after annual hard survey data are available)
> proxy data used here is based on formal sector data, from which informal sector data is inferred
> GDP estimates (lot of assumptions here) for the informal sector are based on past trends; but after the 2016 Demonetisation and 2017 GST implementation and 2020 COVID-19 Outbreak -- the formal and informal sectors are not moving in sync -- meaning for several years after 2016/2017, formal sector has been growing while unorganised sector is degrowing
> Due mainly to negative effects of Demonetisation, GST and COVID-19, informal sector has been shrinking in India; while the the formal corporate sector / India Inc has been growing
> The corporate sector has expanded rapidly while the unorganised sector has suffered badly
> The burden of Demonetisation, GST and COVID-19 has deeply destroyed informal sector in India
> However, the informal sector has recovered in the past two years or so; with the result that the informal sector has again showing positive correlation with changes in the formal sector
>
Data sources:
Chart 91 Click on the chart to view better >
--------------------------------------------------------------
Update 02Dec2025: Chart 90:
India Gold Price Annual Return / India Gold Price Calendar Year Return: Yearly return of domestic gold price vs USD gold price vs USD appreciation / Rupee depreciation: related blog 'Who is Eating my Gold ETF Return? 25Jan2022' > See Update 30Mar2025 with charts 63 and 64 of blog: Forex Data Bank (25-year data on USD gain vs INR) > Blog Sensex versus gold price >
As per IBJA data,
domestic price of gold in India closed yesterday at Rs 128,800 per 10
grams. The USD gold price closed at USD 4,248 per troy ounce, whereas
the rupee closed at 89.53 versus the dollar.
Meanwhile, Nifty 50 has provided tepid returns; it closed last yesterday at 25,176 with a return of 10.7 per cent year to date.
Gold in rupee terms has provided a spectacular return
of 69.1 per cent in 2025 (year to date till 01Dec2025), versus a subdued return of just 10.7 per cent for the Nifty 50 in the same
period. India gold price is driven mainly by world gold price in US dollars, which
has increased by 60.8 per cent YTD, aided in part by Indian rupee's
depreciation against the US dollar.
Other insights from the following chart:
>
India gold price is expressed in Indian rupees, while the USD gold
price is international gold price expressed in US dollars
> USD INR exchange rate is US dollar to Indian rupee
> Though gold does not provide any periodic cash flows, like, bonds or stocks, Indians' love for gold is legendary
> Of the 16 years, in four years only INR gold returns are negative; and in five years USD gold returns are negative
>
INR gold returns in years like 2022, 2018 and 2011 were indeed driven
primarily by the rupee's weakness against the USD rather than the
performance of gold in USD terms.
> In
contrast, 2013 was an outlier where both INR and USD gold prices
dropped, with the USD gold price falling by 27.8 per cent while USD gaining
13 per cent versus the INR. During the year 2013, INR suffered heavily
due to a combination of high current account deficit in India and US
Fed's Taper Tantrum.
>
The INR depreciation acts as a multiplier on the gold price in India,
so even when global gold prices are relatively stable or showing modest
growth, a weakening domestic currency can still lead to significant
positive returns in INR gold
> INR gold returns are higher than USD gold returns due to structural depreciation of the rupee against the dollar over long periods of time
> Periods of high INR gold returns often align with macroeconomic instability or rupee weakness as seen in 2011
>
During 2008-2013, India suffered from high inflation leading to large
depreciation of INR vs USD -- creating outsized INR gold return for
investors in that period
While
gold holds a deep cultural significance in India, is viewed as a safe
haven investment and store of value and has provided superior
inflation-beating returns for decades, its outsized share in household wealth has economic consequences:
> It impedes the growth of capital markets and more productive investments
> It contributes to import dependencies and pressure on forex reserves
> It increases households' vulnerability to gold price volatility without offering any yield.
Of course, it is investors' choice and they are not expected to take a macro view from a country perspective.
As
shown elesewhere (see Update 02Dec2025 with chart 89 below), it's
amazing to note that in the last 25 years, INR gold return has been
negative only in five years -- they are, 2021, 2015, 2014, 2013 and
2001.
In
such a scenario, it's hard to make a case for caution on gold
investments for Indian investors. Anyway, let me make such a case:
The INR depreciation has been a significant factor driving gold prices in India.
In
this light, gold has historically worked as an excellent hedge against
the rupee loss against the dollar and inflation, as gold rises in value
when the rupee weakens. This makes gold especially appealing for Indian
investors, who may see it as a protective asset against currency
depreciation and inflation.
Despite the impressive track record
of INR gold returns, there are a few reasons for caution, on the part of
Indian investors, when considering gold investments:
1. Past four to five years returns may be inflated due to INR Depreciation,
2. If rupee were to gain versus the dollar (low probability event), gold returns may suffer,
3.
If global uncertainities exacerbated by Russia-Ukraine war and others
were to ease, gold's appeal for central banks may diminish,
4. While some portion of gold exposure may be ideal from asset allocation perspective (most
Indian families as it is hold a high proporation of their assets in
gold and / or gold and other precious metals ornaments), over-exposure
may be detrimental to portfolio returns in the long run,
5. Investors should refrain from extrapolating past four to five years good returns into future, and
6. Many a time, asset prices tend to fall on their own weight.
Gold's
volatility, its reliance on INR depreciation and its lack of income
generation mean that overexposure to gold can make investors vulnerable
to risks.
Note:
India gold price return in this update (Update 02Dec2025 with chart 90 using Nippon MF data) are slightly different from IGP returns in the
Update 02Dec2025 with chart 89 below (using Forbes India data), due to
different sources of data.
Data sources:
Nippon India ETF Gold BeES fact sheets - domestic gold return CNBC and others for USD gold price Impact of customs duty cut on gold / silver in Union Budget
Chart
with 16-Year data showing calendar wise returns for India gold price,
USD gold price; and USD appreciation versus Indian rupee >
Chart 90 Click on the chart to view better >
--------------------------------------------------------------
Update 02Dec2025: Chart 89:
Sensex versus Gold Price: Annual return of Sensex compared to annual return India Gold Price (related blog: Sensex versus Gold Price 29May2024):
As
of 31Dec2024, Sensex level and rupee gold price were almost same level
of around 78,200. This looks quite uncanny, but it is true.
During
the Global Financial Crisis (GFC) of 2008 and self-induced crisis of
the UPA government in 2011, gold had offered good protection to Indian
investors with generating decent returns in 2008 and 2011 while Sensex
had disappointed.
In COVID-19 pandemic outbreak year of 2020, gold outperformed Indian stocks by a considerable margin.
Even
in 2025 and 2024, gold has comfortably outperformed Sensex by a
significant margin. The outperformance of gold versus Sensex amounted to
15.6 percentage point in 2024 and so far in 2025, the gold's
outperformance is a massive 55 percentage points.
In the past 25 years (see chart below), Sensex outperformed gold in 13 years and gold outperformed Sensex in 12 years.
But in the past 10 years (2016-2025), gold outperformed Sensex massively in 7 years.
A decade prior to that (2006-2015), Sensex outperformed gold in 7 years.
Past 25 years (2001-2025) absolute return:
(Sensex moved from 3,972 at the end of 2000 to 85,642 by now and gold from 4,400 at end-2000 to 128,800 now):
Sensex: 2,056%
Gold: 2,827%
Past 25 years CAGR %:
Sensex: 13.07%
Gold: 14.46%
Past 10 years (2016-2025) absolute return:
(Sensex moved from 26,118 at the end of 2015 to 85,642 by now and gold from 24,931 at end-2015 to 128,800 now):
Sensex: 228%
Gold: 417%
Past 10 years CAGR %:
Sensex: 12.61%
Gold: 17.85%
Prior decade (2006-2015) absolute return:
(Sensex moved from 9,398 at the end of 2005 to 26,118 at the end of 2015 and gold from 7,638 at end-2005 to 24,931 at end-2015):
Sensex: 178%
Gold: 226%
Prior decade CAGR %:
Sensex: 10.76%
Gold: 12.56%
Note:
India gold price return in this update (Update 02Dec2025 with chart 89 using Forbes India data) are slightly different from IGP returns in the
Update 02Dec2025 with chart 90 above (using Nippon MF data), due to
different sources of data.
Chart showing 25-year data of Sensex and domestic gold price returns >
Chart 89 Click on the chart to view better >
--------------------------------------------------------------
Update 19Nov2025: Chart 88:
Mutual Fund net inflows: India Passive funds net inflows: data include ETFs and Index funds for both equity and debt segments:
Net inflows during first half of FY 2025-26 are Rs 0.44 lakh crore for ETFs and Rs 0.09 lakh crore for index funds -- the data include equity and debt segments (Nifty Indices does not provide break up of equity and debt data).
Net inflows in H1 of 2025-26 seem to have slowed down due to higher redemptions in index funds.
In the past three years (FY 2022-23 to FY 2024-25), net inflows to ETFs and index funds were identical at Rs 1.71 lakh crore.
In the past five years (FY 2020-21 to FY 2024-25), net inflows to ETFs and index funds were at Rs 2.91 lakh crore and Rs 2.20 lakh crore respectively.
Chart 88 Click on the chart to view better >
--------------------------------------------------------------
Update 19Nov2025: Chart 87:
Mutual Fund Assets: Growth of India Passive Equity Funds AUM: Passive Funds AUM data (complement
this
data with 31Mar2025 data as per Update 18Jul2025 with chart 62 and
entire MF industry growth data as per Update 17Jun2025 with chart 50
below):
Between
Mar2025 and Sep2025, total assets under management (AUM) of passive
equity funds grew by Rs 96,000 crore or 11 per cent -- the growth is
primarily driven by Indian stocks recovering from their Mar2025 lows.
In
the same period, the ETF asset growth is 10 per cent while that of
index funds is 18 per cent. The share of ETFs in the total passive pie
is 79 per cent.
As of 30Sep2025, the total number of equity ETF schemes are 207 and the number of index funds are 235, totaling 442.
The number of indices tracked by equity ETFs are 90, while that of index funds are 83.
data: NSE India passive funds - monthly data available
Read more:
Decoding the Nifty Midcap 150 Quality 50 Index: A Midcap Strategy Built on Fundamentals
Chart: India Passive Equity Funds AUM Growth (both ETFs and Index funds tracking BSE as well as NSE / Nifty equity indices)
Chart 87 Click on the chart to view better >
--------------------------------------------------------------
Update 01Nov2025: Charts 85 and 86:
India GST Collections: Goods and Services Tax: Gross GST revenue collections, refund data and net GST revenue collections (Tweet thread 01Jul2017 on GST):
Monthly collections:
Gross GST revenue collections in Oct2025 are Rs 1.96 crores. Net GST revenue collections (net of
refunds) in the same month are 1.69 lakh crore, an improvement over Rs 1.6 lakh crore in Sep2025.
During Oct2025, the year or year (YoY) net GST collections growth rate is tepid at 0.6 per cent
(versus Oct2024 data). The corresponding YoY growth rates for Sep2025, Aug2025, Jul2025, and Jun2025 and May2025 are 5, 10.7, 1.7 and 3.3 per cent respectively. As can
be seen from the below chart, these YoY growth rates are volatile and
not much can be gleaned from the data.
One may have to see more granular data to analyse the monthly GST data.
For
the financial year 2025-26 (seven months till Oct2025), the net GST
collections are Rs 12.07 lakh crore, showing a YoY growth of 7.1 per cent
compared to Apr-Oct2024 period (see two charts below for data).
Average monthly Net GST Collections:
During FY 2025-26 (seven months data till Oct2025), the average monthly
net GST collections are Rs 1.73 lakh crore, compared to average monthly
figure of Rs 1.63 lakh crore for full 2024-25 (see chart below).
Due
to inflationary pressures and other factors, average monthly net GST
collections improved from Rs 0.98 lakh crore for full FY 2018-19 to Rs
1.73 lakh crore now.
Net GST revenue equals gross GST revenue minus GST refunds. GST refund data prior to 2020-21 aren't available with GST Portal.
data sources:
India: Monthly Gross / Net GST Collections from Sep2024 to Oct2025:
Charts 85 and 86 click on them to view better >
--------------------------------------------------------------
Update 30Oct2025: Charts 82 to 84:
India GNI per capita as per World Bank : India's
per capita national income (or simply India per capita income), in current US dollars, grew by an anaemic 2.7 percent
in 2024 to 2,650, as per latest data from World Bank (related blog dated 15Nov2023 and India falling behind Bangladesh).
India's
rank as per capita GNI in current US dollars (Atlas method) is 167 in
the world, among the 227 countries for which data are available.
India's per capita GNI rank slipped from 148 (among 198 countries for which data were available) in 2023 to 167 in 2024.
Gross national
income (GNI) is the total income earned by a nation’s residents and businesses irrespective of where it is
earned. It can be calculated by adding income from foreign countries to country’s
gross domestic product (GDP).
Per
capita GNI is often considered as an indicator of a nation's economic
health and standard of living. In the past 25 years, India's
per capital national income in US dollars grew by an annualised rate of
7.45 per cent.
The Atlas method is a technique used by the World Bank to calculate a country's per capita Gross National Income (GNI) in US dollars. It smooths exchange rate fluctuations by using a three-year average of exchange rates, adjusted for inflation using the GDP deflators of the country and developed economies.
This method provides a more stable and comparable measure of income levels across countries over time.
Data from 1998 to 2024:
As can be observed from the chart, the period from 2003 to 2011 has
seen the biggest jumps in India's per capita GNI in current US dollars.
Comparison with comparable countries: Comparable
countries, like, BRICS, G20 and others are included in the chart below
to see how
India performs relatively. As per World Bank’s 2024 data about per
capita GNI as of Jul2025, India is a lower middle income country.
India's rank at 167 is below that of comparables like, Bangladesh, Egypt and Vietnam. India’s
rank in per capita income is the lowest not only among the
G20 nations, but also among BRICS countries (it may be noted on a per
capita income by purchasing power parity or PPP method, India's rank in 2024 is
slightly higher at 147, with per capita income by PPP at 11,000 current international dollars).
In 2023, Russia moved from an 'upper middle income' country to a 'high income' country, even though the country is at war with Ukraine.
By next year, it is quite likely Vietnam will move from lower middle income to upper middle income country.
World Bank Country Classification: World Bank
divides countries into four groups by their income level. The groups
are: low income, lower middle income, upper middle income and high
income.
The thresholds for
country classification, as on 01Jul2025 for FY 2026, are given in the
below chart. The levels are as per Atlas GNI per capita in current US
dollars (2024 data).
With per capita GNI is USD 2,650, India falls under lower middle income
country. To reach the current threshold (which is likely to go up in
future) of USD 4,495 for upper middle income category, it may take more
than a decade for the world's most populous nation to reach the next
higher income level threshold.
As per 2024 World Bank data, India's population is 145.09 crore or 1.45 billion.
Big Slowdown in India Per Capita GNI annualised growth rates >
7.45% past 25-year CAGR (1999 to 2024)
7.62% 20-y CAGR
5.97% 15-y CAGR
5.58% 10-y CAGR
5.06% 5-y CAGR
There has been a marked slowdown in per capita income (in US dollars) during Thiru PM Modi's government.
Data Sources:
World Bank per capita GNI, Atlas Method (current US dollars) World Bank per capita by PPP (current international dollar)
Note: South Korea data are not updated for 2024 by World Bank, hence, data for 2023 is taken.
--------------------------------------------------------------
Update 30Oct2025: Chart 81:
Growth in Gold loans (loans against gold jewellery):
Gold loans outstanding grew by almost 50 per cent (to be exact 46.5 per cent) from Rs 2.09 lakh crore in Mar2025 to Rs 3.06 lakh crore by Aug2025, as per RBI data.
Interestingly, the growth of all personal loans during Apr-Aug2025 period is just 4.4 per cent versus 46.5 per cent for gold loans.
Betwee Mar2024 and Aug2025, gold loans outstanding trebled from Rs 1+ lakh crore to Rs 3+ lakh crore.
Gold loans were 1.1 per cent of total personal loans in Mar2019 and 2.5 per cent in Mar2021 (COVID-19 effect -- during COVID-19 Pandemic, households borrowed heavily to meet essential hospitalisation charges and medical bills).
As of Aug2025, gold loan outstanding is 4.9 per cent of total personal loans.
The rise in gold loans is partly driven by surging gold prices (and consequent rise in value of the gold jewellery collateral), which may have embolended individuals to borrow more against theier gold ornaments.
Stress on personal incomes and slowdown in real income growth may have forced households to opt for eaily accessible gold loans to meet their consumption needs.
Several large banks and NBFCs have launched digital gold loan products. These include features like:
Instant Top-ups: Allowing existing customers to quickly get additional loan amounts on the same collateral.
Mobile App Renewals/Repayments: Enabling customers to manage their accounts from their phones, reducing the need to visit a branch.
Some examples: Instant gold loan from Manappuram Finance, online gold loan application from HDFC Bank and Axis Bank gold loan.
Faster processing of loan applications through digital mode and rising competition among lenders may have led to sharp increase in retail gold loans in recent years.
Data of gold loans outstanding prior to 2019 is not available in RBI DBIE.
Data sources:
RBI monthly bulletins
RBI DBIE
Tweet dated 30Nov2024
Data from 2019 to 2025 >
Chart 81 click to view better >
--------------------------------------------------------------
Update 28Oct2025: Chart 80:
How Rates and Ratios are Moving : (old blog dated 26May2022)
The
following chart provides data on key interest rates and ratios of
interest rate market in India. The rates and ratios range from CPI
inflation, Policy repo rate, lending and deposit rates, short-term rates
such as call money and Treasury bill yields, long term bond yields and
government-administered small savings rates of PPF, NSC and post office
deposit rates.
By looking at the data over medium and long periods, one can glean some insights. The data presented here are as of 30Sep2025.
In
the past one year, Reserve Bank of India cut repo rate by 100 basis
points (one per cent equals 100 bp), cut CRR by 75 basis points and
injected massive liquidity into the banking system via repo auctions,
forex swaps and buyback of government securities.
But
how much, banks have cut their lending rates, only slowly. The upper bound of the base
rate (lending rate) of banks practically remained the same at 10.40 per cent
in the past one year, while the lower bound got reduced to 8.50 per cent from 9.10 per cent as the below chart shows. MCLR overnight lending
rate decreased slightly from 8.10-8.45 to 7.8-8.0 per cent range.
And
how banks have reduced their interest rates on deposits? Savings bank
rates have been drastically cut from 2.70-3.00 to 2.50 per cent in the past one year.
Mind
you, savings bank deposit rates have remained stagnant since Jun2020,
means no change for almost five years between Jun2020 and May2025!
Bank
fixed deposit rates for one year were reduced from 6.00-7.25 to
5.85-6.60 per cent range.
As
has been highlighted elsewhere many times, monetary policy transmission
has been very weak in India and RBI efforts in improving it have not
borne fruit.
Short
term interest rates have reacted more sharply to RBI rate cuts. Call
money rates, Treasury Bill rates and liquid mutual fund returns fallen
by 60 to 100 basis points in the past quarter. But 10-year G-Sec yield is not showing much movement in the past one year.
For some inexplicable reasons, Govt of India has not revised small savings interest rates (like, post office, NSC, PPF, etc.) -- which are allegedly market-determined rates -- for over a year.
Chart 80 click on the image to view better >
--------------------------------------------------------------
Update 27Oct2025:
Look for Update dated 27Oct2025: with Gold ETF quarterly growth info at close of 30Sep2025 in my blog 'Who is Eating My Gold ETF Return? 25Jan2022 --------------------------------------------------------------
Update 12Oct2025: Chart 79:
India Real interest rates: (old blog
dated 05Aug2021) >
Real interest rate in India for the month of Aug2025 fell to 3.4 per cent from 4.0 per cent (this is the highest since Mar2019) in Jul2025, as India's CPI
inflation declined to 2.1 per cent in Aug2025.
Real interest rate equals LAF repo rate minus CPI inflation.
CPI
inflation, average 1-year bank term deposit rates and India 10-year
G-Sec yield data too have been included in the below chart for
comparison purposes.
Data sources are Reserve Bank of India, MOSPI, CCIL India and author.
Chart 79 click on the image to view better >
--------------------------------------------------------------
Update 01Oct2025: Charts 77 and 78:
India GST Collections: Goods and Services Tax: Gross GST revenue collections, refund data and net GST revenue collections (Tweet thread 01Jul2017 on GST):
Monthly collections:
Gross GST revenue collections in Sep2025 are Rs 1.89 crores. Net GST revenue collections (net of
refunds) in the same month are 1.60 lakh crore.
For the second successive month, net GST collections declined month-on-month. The net GST collections growth rate in Sep2025 is minus 4 per cent compared to Aug2025 figure.
During Sep2025, the year or year (YoY) net GST growth rate is 5.0 per cent
(versus Sep2024 data). The corresponding YoY growth rates for Aug2025, Jul2025,
Jun2025 and May2025 are 10.7, 1.7, 3.3 and 20.4 per cent respectively. As can
be seen from the below chart, these YoY growth rates are volatile and
not much can be gleaned from the data.
One may have to see more granular data to analyse the monthly GST data.
For
the financial year 2025-26 (six months till Sep2025), the net GST
collections are Rs 10.38 lakh crore, showing a YoY growth of 8.3 per cent
compared to Apr-Sep2024 period (see two charts below for data).
Average monthly Net GST Collections:
During FY 2025-26 (six months data till Sep2025), the average monthly
net GST collections are Rs 1.73 lakh crore, compared to average monthly
figure of Rs 1.63 lakh crore for full 2024-25 (see chart below).
Due
to inflationary pressures and other factors, average monthly net GST
collections improved from Rs 0.98 lakh crore for full FY 2018-19 to Rs
1.73 lakh crore now.
Net GST revenue equals gross GST revenue minus GST refunds. GST refund data prior to 2020-21 aren't available with GST Portal.
data sources:
India: Monthly Gross / Net GST Collections from Aug2024 to Sep2025:
India: Yearly Gross / Net GST Collections since 2017-18:
--------------------------------------------------------------
Update 14Sep2025: Chart 76:
Sensex versus Gold Price: Annual return of Sensex compared to annual return India Gold Price (related blog: Sensex versus Gold Price 29May2024):
As of 31Dec2024, Sensex level and rupee gold price were almost same level of around 78,200. This looks quite uncanny, but it is true.
During the Global Financial Crisis (GFC) of 2008 and self-induced crisis of the UPA government in 2011, gold had offered good protection to Indian investors with generating decent returns in 2008 and 2011 while Sensex had disappointed.
In COVID-19 pandemic outbreak year of 2020, gold outperformed Indian stocks by a considerable margin.
Even in 2025 and 2024, gold has comfortably outperformed Sensex by a significant margin. The outperformance of gold versus Sensex amounted to 15.6 percentage point in 2024 and so far in 2025, the gold's outperformance is a massive 34.6 percentage points.
In the past 25 years (see chart below), Sensex outperformed gold in 13 years and gold outperformed Sensex in 12 years.
But in the past 10 years (2016-2025), gold outperformed Sensex massively in 7 years.
A decade prior to that (2006-2015), Sensex outperformed gold in 7 years.
Past 25 years (2001-2025) absolute return:
(Sensex moved from 3,972 at the end of 2000 to 81,905 by now and gold from 4,400 at end-2000 to 109,100 now):
Sensex: 1,962%
Gold: 2,380%
Past 25 years CAGR %:
Sensex: 12.87%
Gold: 13.70%
Past 10 years (2016-2025) absolute return:
(Sensex moved from 26,118 at the end of 2015 to 81,905 by now and gold from 24,931 at end-2015 to 109,100 now):
Sensex: 214%
Gold: 338%
Past 10 years CAGR %:
Sensex: 12.11%
Gold: 15.91%
Prior decade (2006-2015) absolute return:
(Sensex moved from 9,398 at the end of 2005 to 26,118 at the end of 2015 and gold from 7,638 at end-2005 to 24,931 at end-2015):
Sensex: 178%
Gold: 226%
Prior decade CAGR %:
Sensex: 10.76%
Gold: 12.56%
Note:
India gold price return in this update (Update 14Sep2025 with chart 76
using Forbes India data) are slightly different from IGP returns in the
Update 14Sep2025 with chart 74 below (using Nippon MF data), due to
different sources of data.
Chart showing 25-year data of Sensex and domestic gold price returns >
--------------------------------------------------------------
Update 14Sep2025: Chart 75:
India CPI Inflation : India consumer price inflation data:
The
longer the data, the better. Here, CPI inflation print for the past 36 years are given. Figures from FY 2013-14 to 2023-24 are CPI combined
numbers (base 2012: 100), and between 1990 and 2011, they are CPI -
industrial workers.
It may be noted CPI inflation rates are financial year-end numbers, i.e., for March-end.
--------------------------------------------------------------
Update 14Sep2025: Chart 74:
India Gold Price Annual Return : Yearly return of domestic gold price vs USD gold price vs USD appreciation / Rupee depreciation: related blog 'Who is Eating my Gold ETF Return? 25Jan2022' > See Update 30Mar2025 with charts 63 and 64 of blog: Forex Data Bank (25-year data on USD gain vs INR) > Blog Sensex versus gold price >
As per IBJA data, domestic price of gold in India closed last Friday at Rs 109,100 per 10 grams. The USD gold price closed at USD 3,680 per troy ounce, whereas the rupee closed at 88.26 versus the dollar.
Meanwhile, Nifty 50 is struggling; it closed last Friday at 25,110 with a negative return of 1 per cent in the past one year.
Gold in rupee terms has provided a spectacular return of 43 per cent in 2025 (year to date till 12Sep2025), versus a pedestrian return of just 6.2 per cent for the Nifty 50 in the same period. This is driven mainly by world gold price in US dollars, which has increased by 39.4 per cent YTD, aided in part by Indian rupee's depreciation against the US dollar.
Other insights from the following chart:
> India gold price is expressed in Indian rupees, while the USD gold price is international gold price expressed in US dollars
> USD INR exchange rate is US dollar to Indian rupee
> Indians intutitively tend to buy more of real estate and gold; with gold they have been immensely rewarded for several decades
> Indian investors, like global ones, see gold as a hedge against inflation, but in the long run the view is likey to be challenged as asset prices suffer from cyclicality and intense volatility and gold is no exception
> Though gold does not provide any periodic cash flows, like, bonds or stocks, Indians' love for gold is legendary
> Of the 16 years, in four years only INR gold returns are negative; and in five years USD gold returns are negative
> INR gold returns in years like 2022, 2018 and 2011 were indeed driven primarily by the rupee's weakness against the USD rather than the performance of gold in USD terms.
> In contrast, 2013 was an outlier where both INR and USD gold prices dropped, with the USD gold price falling by 27.8 per cent while USD gaining 13 per cent versus the INR. During the year 2013, INR suffered heavily due to a combination of high current account deficit in India and US Fed's Taper Tantrum.
> The INR depreciation acts as a multiplier on the gold price in India, so even when global gold prices are relatively stable or showing modest growth, a weakening domestic currency can still lead to significant positive returns in INR gold
> INR gold returns are higher than USD gold returns due to structural depreciation of the rupee against the dollar over long periods of time
> Periods of high INR gold returns often align with macroeconomic instability or rupee weakness as seen in 2011
> During 2008-2013, India suffered from high inflation leading to large depreciation of INR vs USD -- creating outsized INR gold return for investors in that period
While gold holds a deep cultural significance in India, is viewed as a safe haven investment and store of value and has provided superior inflation-beating returns for decades, its outsized share in household wealth has economic consequences:
> It impedes the growth of capital markets and more productive investments
> It contributes to import dependencies and pressure on forex reserves
> It increases households' vulnerability to gold price volatility without offering any yield.
Of course, it is investors' choice and they are not expected to take a macro view from a country perspective.
As shown elesewhere (see Update 14Sep2025 with chart 76 above), it's amazing to note that in the last 25 years, INR gold return has been negative only in five years -- they are, 2021, 2015, 2014, 2013 and 2001.
In such a scenario, it's hard to make a case for caution on gold investments for Indian investors. Anyway, let me make such a case:
The INR depreciation has been a significant factor driving gold prices in India.
In this light, gold has historically worked as an excellent hedge against the rupee loss against the dollar and inflation, as gold rises in value when the rupee weakens. This makes gold especially appealing for Indian investors, who may see it as a protective asset against currency depreciation and inflation.
Despite the impressive track record of INR gold returns, there are a few reasons for caution, on the part of Indian investors, when considering gold investments:
1. Past four to five years returns may be inflated due to INR Depreciation,
2. If rupee were to gain versus the dollar (low probability event), gold returns may suffer,
3. If global uncertainities exacerbated by Russia-Ukraine war and others were to ease, gold's appeal for central banks may diminish,
4. While some portion of gold exposure may be ideal from asset allocation perspective (most Indian families as it is hold a high proporation of their assets in gold and / or gold and other precious metals ornaments), over-exposure may be detrimental to portfolio returns in the long run,
5. Investors should refrain from extrapolating past four to five years good returns into future, and
6. Many a time, asset prices tend to fall on their own weight.
Gold's volatility, its reliance on INR depreciation and its lack of income generation mean that overexposure to gold can make investors vulnerable to risks.
Note: India gold price return in this update (Update 14Sep2025 with chart 74 using Nippon MF data) are slightly different from IGP returns in the Update 14Sep2025 with chart 76 above (using Forbes India data), due to different sources of data.
Data sources:
Nippon India ETF Gold BeES fact sheets - domestic gold return CNBC and others for USD gold price Impact of customs duty cut on gold / silver in Union Budget
Chart with 16-Year data showing calendar wise returns for India gold price, USD gold price; and USD appreciation versus Indian rupee >
--------------------------------------------------------------
Update 12Sep2025: Chart 73:
India CPI Inflation : India consumer price inflation data:
The
following chart shows: cumulative CPI inflation numbers for the
past 10, five and three years,
The
cumulative data will give you a new perspective on how much consumers
have suffered over the years, instead of just looking at one-year
numbers.
The
data shown in the chart are for the past 15 months -- cumulative data
for 10, 5 and 3 years are given. Year-on-year CPI inflation is also
included in the chart.
After easing continuously for nine months till Jul2025, CPI inflation ticked up slightly to 2.1 per cent in Aug2025 (previous month 1.6 per cent).
But
if you compare the cumulative inflation, it clearly shows Indian
consumers still face long term price pressures -- as indicated by 3-year
cumulative price rise of 13.0 per cent and 5-year cumulative price rise
of 27.3 per cent as at the end of Aug2025.
--------------------------------------------------------------
Update 01Sep2025: Charts 71 and 72:
India GST Collections: Goods and Services Tax: Gross GST revenue collections, refund data and net GST revenue collections (Tweet thread 01Jul2017 on GST):
Monthly collections:
Gross GST revenue collections in Aug2025 are Rs 1.86 crores. Net GST revenue collections (net of
refunds) in the same month are 1.67 lakh crore.
During Aug2025, the year or year (YoY) net GST growth rate is 10.7 per cent (versus Aug2024 data). The corresponding YoY growth rates for Jul2025, Jun2025 and May2025 are 1.7, 3.3 and 20.4 per cent respectively. As can be seen from the below chart, these YoY growth rates are volatile and not much can be gleaned from the data.
One may have to see more granular data to analyse the monthly GST data.
The net GST collections growth rate in Aug2025 is minus 1 per cent compared to Jul2025 figure.
For the financial year 2025-26 (five months till Aug2025), the net GST collections are Rs 8.78 lakh crore, showing a YoY growth of 8.8 per cent compared to Apr-Aug2024 period (see two charts below for data).
Average monthly Net GST Collections: During FY 2025-26 (five months data till Aug2025), the average monthly net GST collections are Rs 1.76 lakh crore, compared to average monthly figure of Rs 1.63 lakh crore for full 2024-25 (see chart below).
Due to inflationary pressures and other factors, average monthly net GST collections improved from Rs 0.98 lakh crore for full FY 2018-19 to Rs 1.76 lakh crore now.
Net GST revenue equals gross GST revenue minus GST refunds. GST refund data prior to 2020-21 aren't available with GST Portal.
data sources:
India: Monthly Gross / Net GST Collections from Aug2024 to Aug2025:
India: Yearly Gross / Net GST Collections since 2017-18:
--------------------------------------------------------------
Update 29Aug2025: Chart 70:
India GDP quarterly growth rates: Real GDP and Nominal GDP Growth Rates %: Data from Apr-Jun2023 to Apr-Jun2025 Quarter:
For the Apr-Jun2025 quarter, India real GDP clocked a year-on-year (yoy) growth rate of 7.8 per cent, the highest in the past five quarters. However, the nominal GDP growth rate (yoy) slumped to 8.8 per cent, the lowest in three quarters.
The second quarter real GDP growth is driven by: manufacturing, construction, services (trade, hotels, communication, finance, real estate and others) and government capex.
However, mining and utility sectors have shown tepid or negative growth.
For the past four quarters (Jul2024-Jun2025), India's real GDP is Rs 191.44 lakh crore, while the nominal GDP is Rs 337.66 lakh crore in the same period.
India market cap-GDP ratio: As of today, that is 29Aug2025, the market cap of all BSE companies is Rs 443.66 lakh crore. The market cap to GDP ratio, based on the Jul2024-Jun2025 nominal GDP, works out to 131 per cent, which is high by historical standards.
India follows an April to March financial year.
Data sources:
--------------------------------------------------------------
Update 19Aug2025: Chart 69:
Growth in Gold loans (loans against gold jewellery):
Gold loans outstanding more than doubled from Rs 1.03 lakh crore in Mar2024 to Rs 2.09 lakh crore in Mar2025, as per RBI data.
Though RBI does not state what contributed to the more than 100 per cent growth in gold loan outstanding, there is some re-classification of data by a bank. According to RBI, a bank since May2024 started classifying a type of agricultural loan as retail gold loan -- this partly explains the 100%+ growth in FY 2024-25.
Gold
loans were 1.1 per cent of total personal loans in Mar2019 and 2.5 per cent
in Mar2021 (COVID-19 effect -- during COVID-19 Pandemic, households
borrowed heavily to meet essential hospitalisation charges and medical
bills).
As of Mar2025, gold loan outstanding is 3.5 per cent of total personal loans and this ratio spiked to 4.1 per cent as of May20205.
Between Mar2025 and May2025, gold loan outstanding surged by 20 per cent from Rs 2.09 lakh crore to Rs 2.51 lakh crore.
In the second half of 2024, high growth in retail gold loan outstandings attracted the attention of Indian media, giving out a lot of theories about stress in middle class incomes and rising household indebtedness.
But these days, nobody seems to care about growth in retail gold loans. Between Mar2025 and May2025, the gold loan outstanding grew by a phenomenal 20 per cent.
Data of gold loans outstanding prior to 2019 is not available in RBI DBIE.
Data sources:
Data from 2019 to 2025 >
--------------------------------------------------------------
Update 19Aug2025: Chart 68:
India GST Collections: Goods and Services Tax: Gross GST revenue collections, refund data and net GST revenue collections (Tweet thread 01Jul2017 on GST):
Monthly collections: Gross GST revenue collections in Jul2025 are Rs 1.96 crores, recording a growth of 7.5% over Jul2024. Net GST revenue collections (net of refunds) in the same month are 1.69 lakh crore. The net GST growth rate (year-on-year) is just 1.7 per cent in Jul2025 due to higher GST refunds.
Net GST revenue equals gross GST revenue minus GST refunds. GST refund data prior to 2020-21 aren't available with GST Portal.
Yearly growth rates of Net GST Collections as on 31Mar2025:
1-year growth rate is 8.6%,
3-year annualised growth is 14.6%, and
5-year annualised growth is 9.9%.
Yearly growth rates of Nominal GDP as on 31Mar2025 (see Update 07Jul2025 with chart 59 below):
1-year growth rate is 9.8%,
3-year annualised growth is 11.9%,
5-year annualised growth is 10.5%, and
10-year annualised growth is 10.2%.
Key insight: Compare these two growth rates >
5-year annualised growth rate of 9.9 per cent in net GST collections closely aligns with 5-year annualised growth rate of 10.5 per cent in nominal GDP.
Over the long term, the growth rates appear to move in tandem.
GST was rolled out by Modi government effective 01Jul2017.
data sources:
India: Gross / Net GST Collections since 2017-18:
--------------------------------------------------------------
Update 12Aug2025: Chart 67:
India Retail Investors and Growth of Demat Accounts: Rapid Rise in number of retail investors and demat accounts (old blog dated 24Feb2022 Spectacular Rise of India Retail Investors and Demat Accounts)
The number of demat accounts in India have surpassed 20 crore (or 200 million) mark for the first time (data upto 31Jul2025, see chart below).
Key Highlights from the chart 67:
Total cumulative demat accounts (as of 31 Jul 2025): 20.2 crore
of which:
> CDSL: 16.1 crore
> NSDL: 4.1 crore
This milestone reflects the rapid rise in retail investor participation in Indian financial markets, especially post-2020.
Growth Context:
> Just five years ago (end-Mar2020): Total demat accounts were 4.1 crore
> Increased by 16 crore accounts in about five years
> Financial year 2024-25 alone saw 4.2 crore new accounts added -- the highest in a single year
This post-COVID-19 surge highlights phenomenal rise of retail investing during COVID-19 lockdowns, growing financial literacy, lack of investment alternatives and fall of bank deposit interest rates, easier digital onboarding and increasing equity market participation (especially retail investors' exuberance for IPO market) across the country.
Absolute growth rates in number of demat account as on 31Mar2025:
1-year: CDSL 32%; NSDL 13%; total 28%
3-year: CDSL 143%; NSDL 48%; total 115%
5-year: CDSL 620%; NSDL 100%; total 370%
The growth in demat accounts has been led single handedly by CDSL or Central Depository Services (India) Ltd. Compared to CDSL, the growth numbers from NSDL or National Securities Depository Ltd are tepid though they have doubled the number in the past five years.
The share of CDSL in the cumulative number of demat accounts is nearly 80 per cent as of Mar2025. Their share was just 41 per cent 10 years ago.
Monthly average growth
The
monthly average of new demat accounts opened has shown a remarkable
transformation over the years, especially post-2020. Here's what stands
out from the chart:
Acceleration Phase from 2020 onwards: Year
2024-25 was the highest ever, with an average of 35 lakh new accounts
per month -- a historic peak.
As of Jul2025, the average for FY 2025-26 is 24.2 lakh per month, lower than the previous two years.
This
may indicate: market consolidation or cooling enthusiasm, saturation in
urban retail participation or investors awaiting next trigger (for
example, strong market rally, IPO cycle).
The monthly average has
evolved from below 1 lakh per month (2013) to a peak of 35 lakh per month
(2024) -- a 50 times increase in a decade.
Chart showing growth of demat accounts in India >
click on the chart to view better >
--------------------------------------------------------------
Update 09Aug2025: Chart 66:
Mutual Fund Assets: Growth of India's Passive Equity Funds: Passive Funds AUM data (complement this
data with 31Mar2025 data as per Update 18Jul2025 with chart 62 and entire MF industry growth data as per Update 17Jun2025 with chart 50 below): Between Mar2025 and Jun2025, total assets under management (AUM) of passive equity funds grew by Rs 1.02 lakh crore or 12 per cent -- the growth is primarily driven by Indian stocks recovering from their Mar2025 lows. In the same period, the ETF asset growth is 11 per cent while that of index funds is 16 per cent. The share of ETFs in the total passive pie is nearly 80 per cent. As of 30Jun2025, the total number of equity ETF schemes are 197 and the number of index funds are 218, totaling 415. The number of indices tracked by equity ETFs are 86, while that of index funds are 78.
Read more: Decoding the Nifty Midcap 150 Quality 50 Index: A Midcap Strategy Built on Fundamentals Chart: India Passive Equity Funds AUM Growth (both ETFs and Index funds tracking BSE as well as NSE / Nifty equity indices) Click on the chart to view better > |
|
--------------------------------------------------------------
Update 30Jul2025: Chart 65:
How Rates and Ratios are Moving : (old blog dated 26May2022)
The
following chart provides data on key interest rates and ratios of
interest rate market in India. The rates and ratios range from CPI
inflation, Policy repo rate, lending and deposit rates, short-term rates
such as call money and Treasury bill yields, long term bond yields and
government-administered small savings rates of PPF, NSC and post office
deposit rates.
By looking at the data over medium and long periods, one can glean some insights. The data presented here are as of 30Jun2025.
In the past one year, Reserve Bank of India cut repo rate by 100 basis points (one per cent equals 100 bp), cut CRR by 50 basis points and injected massive liquidity into the banking system via repo auctions, forex swaps and buyback of government securities.
But how much, banks have cut their lending rates, practically nothing. Base rate (lending rate) of banks remained the same at 9.10-10.30 per cent in the past one year as the below chart shows. MCLR overnight lending rate decreased slightly from 8.10-8.60 to 7.95-8.25 per cent range.
And how banks have reduced their interest rates on deposits? Savings bank rates have been drastically cut from 2.70-3.00 to 2.50-2.75 per cent range in the past one year.
Mind you, savings bank deposit rates have remained stagnant since Jun2020, means no change for almost five years between Jun2020 and May2025!
Bank fixed deposit rates for one year were reduced from 6.00-7.30 to 5.85-6.70 per cent range. Compared to bank lending rates, deposit rates have been cut more drastically.
As has been highlighted elsewhere many times, monetary policy transmission has been very weak in India and RBI efforts in improving it have not borne fruit.
Short term interest rates have reacted more sharply to RBI rate cuts. Call money rates, Treasury Bill rates and liquid mutual fund returns fallen by 40 to 100 basis points in the past quarter. But 10-year G-Sec yield is not showing much movement in the past one quarter.
Click on the image to view better >
--------------------------------------------------------------
Update 30Jul2025: Chart 64:
India CPI Inflation : India consumer price inflation data:
The
following chart shows: cumulative CPI inflation numbers for the
past 10, five and three years,
The
cumulative data will give you a new perspective on how much consumers
have suffered over the years, instead of just looking at one-year
numbers.
The
data shown in the chart are for the past 15 months -- cumulative data
for 10, 5 and 3 years are given. Year-on-year CPI inflation is also
included in the chart.
As CPI print eased for the past eight months consecutively, one-year figure dropped to 2.1 per cent in Jun2025, making impact of inflation lesser. But this is only a statistical illusion, which may not last for more than three to four months.
But if you compare the cumulative inflation, it clearly shows Indian consumers still face long term price pressures -- as indicated by 3-year cumulative price rise of 12.5 per cent and 5-year cumulative price rise of 27.9 per cent as at the end of Jun2025.
--------------------------------------------------------------
Update 30Jul2025: Chart 63:
Real interest rates in India: (old blog
dated 05Aug2021) Real interest rate in India for the month of Jun2025
rose to 3.4 per cent (this is the highest since Mar2019) versus 3.2 per cent in May2025, as India's CPI
inflation declined to 2.1 per cent. Real interest rate equals LAF repo rate minus CPI inflation.
CPI inflation, average 1-year bank term deposit rates and India 10-year G-Sec yield data too have been included in the below chart for comparison purposes.
Data sources are Reserve Bank of India, MOSPI, CCIL India and author.
--------------------------------------------------------------
Update 18Jul2025: Chart 62:
Mutual Fund Assets: Growth of India Passive Equity Funds: Rapid growth of passive equity funds in the past eight years (complement this data with entire MF industry growth data as per Update 17Jun2025 with Chart 50 below):
India’s mutual fund industry has seen stellar growth, with total AUM or assets under management crossing Rs 65 lakh crore as of 31Mar2025, with active equity funds alone managing Rs 29.45 lakh crore (excluding equity portion of hybrid funds), according to data from mutual fund industry body AMFI.
Of the total AUM of Rs 65.74 lakh crore, passive equity vehicles—comprising ETFs and index funds—hold around Rs 8.37 lakh crore as on 31Mar2025, according to NiftyIndices.com data (see chart attached below).
ETF and Index Fund split: Out of the total Rs 8.37 lakh crore passive AUM, the share of equity ETFs in the total passive AUM is 80 per cent or Rs 6.67 lakh crore and that of index funds is 20 per cent or Rs 1.70 lakh crore. Five years ago, the share of ETFs was 94 per cent -- the share has come down due to rapid rise of index funds in comparison to ETFs.
However, the passive space is still dominated by ETFs.
Number of passive funds: As on 31Mar2025, the total number of passive funds is 385, with number of ETFs and index funds at 183 and 202 respectively.
Number of indices tracked by passive funds: As on 31Mar2025, the number of equity indices tracked by ETFs are 81 while the number for index funds is 72.
Spectacular asset growth rates: Data as of 31Mar2025:
One-year, 3-year and 5-year growth rates for total passive equity AUM are 26, 115 and 508 per cent respectively.
The same for ETF assets are 18, 91 and 414 per cent respectively. The 1-, 3- and 5-year asset growth rates for index funds are 65, 330 and 2,016 per cent respectively.
The asset growth rates for index funds are far superior versus ETFs -- it may be added index funds started with a small base of about Rs 8,000 crore assets five years go.
Growth rates in number of funds: Data as of 31Mar2025:
Number of ETFs grew from 68 to 183 in the past five years (roughly 170 per cent growth). In the same period, number of index funds rose from 32 to 202 (530 per cent growth).
The total number passive equity funds grew from 100 five years ago to 385 now, showing a growth of 285 per cent.
Note: The data on passive funds as on 30Jun2025 are yet to be published by NiftyIndices.com.
Passive Investing in India Still Corporate-Dominated: Meagre HNIs and Retail share:
The data reveal a strikingly low share of HNIs and retail investors in India's passive landscape (both equity as well as debt):
Dominance of Corporates: Nearly 90 per cent of the total AUM is held by corporates indicating that corporate treasuries (including EPFO -- see Update 19Jun2025 with charts 51 to 55 below) are the primary drivers of passive fund inflows in India.
Minimal Participation from HNIs and Retail: HNIs (High Net Worth Individuals) share is just 7.2 per cent while that of retail investors is merely 2.6 per cent of the total.
Together, they contribute less than 10 per cent of the total AUM, underscoring a massive under-representation in the passive investment space.
Negligible Bank and FPI Presence: Banks account for only less than one per cent and FPIs (Foreign Portfolio Investors) have zero exposure in this segment.
Despite global trends of growing retail and HNI participation in passive investing, India remains largely institution-led, especially by corporates.
The low share of HNIs and retail investors in India's passive AUM signals significant untapped potential. For broader participation, asset managers and regulators may need to focus on investor education, product innovation and distribution accessibility.
Read more:
Chart: India Passive Equity Funds AUM Growth (both ETFs and Index funds tracking BSE as well as NSE / Nifty equity indices)
Click on the chart to view better >
--------------------------------------------------------------
Update 13Jul2025: Charts 60 and 61:
Public Debt: India G-Sec Outstanding: Share of 30 Years+: The share of 30 Years+ G-Sec outstanding out of total India G-Secs has been raising steadily over the years.
As of 07Jul2025, total Government Securities (G-Secs) outstanding is Rs 114.61 lakh crore. Out of which, the total outstanding G-Secs with maturity of 30 years and above (maturing between financial years 2055-56 and 2074-75) is Rs 16.06 lakh crore.
So, the share of G-Sec outstanding 30 years and above is 14 per cent now (chart below), and it has been raising steadily over the years.
It may be recalled Government of India in Nov2023 issued a 50-year sovereign bond for the first time. Bonds issued by Government of India are commonly known as G-Secs.
Ever since, Modi government has been routinely borrowing money from public through 40- and 50-year sovereign bonds. It's worth noting, both the bonds were started during the Modi government.
Why is this a concern: The point is government needs to pay higher interest on long-dated bonds, like, the 40- and 50-year bonds. This leads to greater interest cost for the government.
Based on the latest available information, Govt of India spends nearly 25 paise on interest payments from every rupee it receives. The 25 per cent interest cost is a huge burden on government resources.
Which means a significant portion of public money is being used just to service existing debt, not to fund development, welfare or infrastructure.
(note: if you take total budgeted expenditure of Govt of India during 2025-26, interest payments constitute 37 per cent)
Stealing from the future: Indian government constantly raises money to repay old debt. And they roll over debt and interest payments grow every year leading to huge burden for future generations.
With governments spending heavily on politically motivated schemes, your children will inherit the debt, pay higher taxes, assume governments' interest burden and lose access to better public services.
It's okay if current borrowings are used for productive purposes and building future capacities, but unfortunately it is not the case.
It's noteworthy Indian government does not exercise any restraint from issuing 40- and 50-year bonds, while the US Treasury has been reluctant to issue them. Though the US Treasury explored the idea in 2020, they have refrained from issuing long-dated Treasury securities beyond 30 years.
Of course, the US dollar enjoys global reserve currency status and as such the needs of the US are different from India's.
Public Debt break-up:
As the below chart shows, public debt in India consists of internal and
external debt. The components of internal debt are G-Sec loans, treasury
bills, cash management bills, special securities, small savings schemes and state government loans.
External
debt consists mainly of money raised from World Bank, IMF and bilateral
sources, external commercial borrowings (ECBs) and NRI deposits.
References:
RBI FAQs on India Govt Securities market
Two charts:
India G-Sec Outstanding: Share of 30 Years+
India Public Debt: Its Components
--------------------------------------------------------------
Update 07Jul2025: Chart 59:
India GDP yearly growth rates: Nominal GDP Growth Rates %: Data from 1998-99 to 2024-25:
In simple terms, nominal GDP is the money value of everything India produces in a year, using the prices of that same year. It is national income without adjusting for inflation. Nominal GDP is sometimes termed as GDP at current prices.
Real GDP is derived from nominal GDP after adjusting the latter with inflation (see update 30Jun2025 chart 56 for real GDP growth rates). Real GDP is often known as GDP at constant prices.
As per data from Reserve Bank of India, India nominal GDP for FY 2024-25 is Rs 330.68 lakh crore, with a growth of 9.8 per cent, which is lower than the growth of 12 per cent for 2023-24.
Reasons for slower nominal GDP growth in 2024-25:
- lower CPI inflation for the year versus previous year
- slowing domestic consumption
- tepid export growth
- subdued government expenditure and delayed projects
- anemic growth in private investment
Yearly growth rates of Nominal GDP as on 31Mar2025:
1-year growth rate is 9.8%,
3-year annualised growth is 11.9%,
5-year annualised growth is 10.5%, and
10-year annualised growth is 10.2%.
Chart showing India nominal GDP and growth rates % from 1998-99 to 2024-25:
--------------------------------------------------------------
Update 07Jul2025: Charts 57 and 58:
AMFI List: Classification of Indian stocks by market capitalization: To be followed by Equity Mutual Funds or EMFs (old blog dated 17Feb2024 / Tweet thread 05Jan2023)
In
October 2017, India's capital market regulator Securities and Exchange
Board of India (SEBI) categorized mutual fund schemes into six
categories, like, equity schemes, debt schemes, hybrid schemes and so on
-- with a view to providing clear distinction and uniformity, in terms
of asset allocation and investment strategy, to mutual fund plans.
SEBI's
broad idea is investors, while assessing various mutual fund plans,
should be able to properly understand the plans in terms of similarity
of plans and uniformity of their characteristics.
When
SEBI says a certain percentage of total assets has to be invested in
large- or mid- or small-cap stocks, SEBI needs to define what these
stocks are. Hence, SEBI decided to define stocks on the basis of their
market capitalisation as follows:
1) large-cap stocks: 1st to 100th company in terms of full market capitalization
2) mid-cap stocks: 101st to 250th company in terms of full market capitalization
3) small-cap stocks: 251st company onwards in terms of full market capitalization
In
order to adhere to SEBI's definition of stocks my market
capitalization, Association of Mutual Funds in India (AMFI) prepares a
list of all listed stocks (more than 5,000 in number) based on their
average market capitalisation and publishes the list of large-, mid- and
small-cap stocks as per SEBI definition.
AMFI is an industry body representing all mutual fund companies in India.
AMFI
prepares the list two times in a year, that is, at the end of June and
December of every year. AMFI publishes the list within five calendar
days from the end of the six-month period. Once the list is updated by
AMFI, mutual funds need to rebalance their portfolios as per the updated
list, within a period of one month.
The below charts provide data as published by AMFI for the half-yearly period (based on average market capitalization of stocks during Jan-Jul2025) ended 30Jun2025.
Half-yearly and yearly changes in average market caps:
As Indian stocks have fallen during Jan-Mar period this year, the half-year average market caps for large-, mid- and small-caps have fallen. For example, Between 31Dec2024 and 30Jun2025, the market caps of large-, mid- and small-cap stocks fell by 8.5, 7.4 and 7.3 per cent respectively (see second chart below).
And between Jun2024 and Jun2025, the large-, mid- and small-cap stock market cap averages grew by 8.6, 11.6 and 10.6 respectively.
Chart: Snapshot of AMFI classification of stocks by market cap:
Chart: AMFI classification and changes in market cap over the past one year and half-year:
--------------------------------------------------------------
Update 30Jun2025: Chart 56:
India GDP yearly growth rates: Real GDP Growth Rates %: Data from 1998-99 to 2024-25:
India real GDP grew by 6.5 per cent during FY 2024-25, compared to 9.2 per cent in 2023-24.
The slower growth rate of 2024-25 can be attributed to:
> drop in government capital expenditure (blamed on 2024 general elections)
> subdued private investment
> weak domestic consumption due to pressure on incomes of middle classes
> inflationary pressures in economy, though RBI maintained a tight monetary policy stance
> subsidy cuts by Government of India
> high-base of previous year could also be a dampener
Real GDP is derived from nominal GDP after adjusting
for GDP deflator, which is derived from CPI (consumer price inflation)
and WPI (wholesale price inflation).
Data sources:
RBI DBIE: Macro-economic aggregates (at constant prices)
India real GDP growth rates (base year 2011-12) from 1998-99 to 2024-25 >
--------------------------------------------------------------
Update 19Jun2025: Charts 51 to 55:
EPFO Investments in Equity ETFs: (Old blog dated 18Mar2023):
Employees'
Provident Fund Organisation (EPFO) is a statutory body established by
the Government of India. EPFO collects, administers and manages
provident funds and pension funds of various employees in India.
EPFO invests, among other things, in debt securities and equity exchange traded funds (ETFs).
According to a PIB press release
on 02Dec2024, in FY 2024-25 (till Oct2024), EPFO invested Rs 34,208
crore in equity ETFs; as against Rs 57,184 crore invested for the entire
FY 2023-24. Since August 2015,
EPFO's gross investments (does not include redemptions) in equity ETFs
amount to Rs 325,900 crore till 31Oct2024. This is just face value of
the gross
investments made by EPFO.
Due
to significant amounts being invested by EPFO in Indian equities since
2015 and rising investments by mutual funds in India in recent years,
the dominance of domestic institutional institutions (DIIs) has
increased. The flow of money from DIIs has been acting as a
counterweight to FPIs or foreign portfolio investors in the Indian stock market. The share of FPIs in Indian equities (FPI AUC) has progressively come down from 19.5 per cent in Mar2017 to 16.2 per cent in Mar2025.
The
total corpus of various funds managed by EPFO is Rs 24.76 lakh crore,
of which equity ETF investments are Rs 2.35 lakh crore as on 31Mar2024.
Equity ETFs alone account for just 9.5 per cent of the total EPFO
corpus.
Total
AUM of ETFs (includes debt and equity ETFs, but excludes gold ETFs) in
India is Rs 7.80 lakh crore as on 31May2025. It swelled phenomenally
from a level of just Rs 6,700 crore as on 31Dec2014.
EPFO
has invested only in 10 equity ETFs. The total AUM of these 10 equity
ETFs is Rs 6 lakh crore. Only these 10 ETFs (due to heavy
investments by EPFO) account for a staggering 83 per cent of the total
AUM of 197 equity ETFs in India as of 31May2025.
Effective 03Jul2023, EPFO started investing in ETFs based on Nifty 50 and Sensex indices from Nippon India MF and ICICI Prudential MF, in addition to those from SBI MF and UTI MF.
The groundwork for
EPFO investments in equity ETFs was initiated in 2013 by the then
finance minister, P Chidambaram in his 2013-14 budget speech (see old blog). Economic reforms are a continuum, no single political party can claim credit for them entirely. The stellar initiative for EPFO investment in equity ETFs was started by UPA II government of Manmohan Singh; and Modi government should get credit for following up on the previous government's pioneering spirit.
Data sources:
Charts:
EPFO Investments in Equity ETFs: 2015 to 2024
Total corpus of various funds managed by EPFO
Total assets of ETFs in India (excluding gold ETFs)
AUM of 10 ETFs in which EPFO invested
Timeline of EPFO Equity Investment Pattern
--------------------------------------------------------------
Update 17Jun2025: Chart 50:
Mutual Fund Assets: Growth of India Mutual Fund Industry: (For a detailed analysis, please refer to the blog dated 18Jul2024)
In
the 2024-25 financial year, India's mutual fund industry experienced an
impressive 23 per cent growth in assets under management (AUM), as per AMFI data. The growth rate, however, is lower compared to 36 per cent growth in 2023-24.
The
industry's total assets surged from Rs 53.40 lakh crore on 31Mar2024 to
Rs 65.74 lakh crore by 31Mar2025, reflecting robust investor
participation and growing confidence in mutual funds as an investment
vehicle.
As on 31May2025, the total assets further grew to Rs 72.20 lakh crore, the growth may have been contributed mainly by rebound in Indian equity market during the past two to three months.
Growth from 2013 to 2025 >
--------------------------------------------------------------
Update 13Jun2025: Charts 48 and 49:
Total Assets of National Pension System (NPS): Total
assets under management (AUM) of NPS, including those of Atal Pension
Yojana (APY) are Rs 14.44 lakh crore as on 31Mar2025. The year-on-year growth of the NPS assets is 23 per cent, below the 31 per cent growth achieved in FY 2023-24.
The NPS assets have since grown to Rs 14.74 lakh crore as on 31May2025.
MF comparison: It may be mentioned the AUM of Indian mutual fund industry as on
31May2025 is Rs 72.2 lakh crore, which is almost five times the AUM of
NPS.
In the past five years
(between Mar2020 and Mar2025), the absolute growth in NPS assets is a
staggering 264 per cent.
The growth in NPS assets in the recent past can be attributed to several factors, including:
> An increase in new subscribers, in line with economic growth
> additional tax incentives exclusively for NPS
> shift from traditional (Defined Benefit or DB) to Defined Contribution (DC) system
> stronger performance in equities, which has led to significant appreciation in asset values
> NPS returns over the years have been decent and competitive making NPS attractive
> greater awareness of the NPS benefits, driving more participation and investments
> more corporates and employers have been offering NPS to their staff
> inflationary pressures may have also contributed to the growth in asset values
Of the NPS assets, the main asset classes are government securities or G-Sec (54.6 per cent of total assets), corporate bond (23.0 per cent) and equity (19.1 per cent).
The share of equity in NPS assets grew from 14 per cent in Mar2019 to 19 per cent in Mar2025.
There are 11 pension fund
managers (PFMs) registered under NPS. The top five PFMs by assets, as
on 31Mar2025, are SBI Pension Fund, LIC PF, UTI PF, HDFC PF and ICICI
PF. Interestingly, the top three PFMs manage 87 per cent of NPS
assets as on 31Mar2025.
Data sources for the two charts below:
Chart showing asset-wise classification of NPS (data from Mar2012 to Mar2025):
PFM-wise AUM as on 31Mar2025 >
--------------------------------------------------------------
Update 13Jun2025: Chart 47:
Real interest rates in India: (old blog
dated 05Aug2021) Real interest rate in India for the month of May2025
rose to 3.2 per cent (this is the highest since Mar2019) versus 2.8 per cent in Apr2025, as India's CPI
inflation declined to 2.8 per cent.
The RBI cut
LAF Repo rate by 50 basis points to 5.5 per cent on 06Jun2025.
If you consider the repo rate for this month, the current real interest rate would be 2.7 per cent.
Real interest rate equals LAF repo rate minus CPI inflation.
CPI inflation and India 10-year G-Sec yield data too have been included in the below chart for comparison purposes.
It may be recalled Indian savers
suffered negative real interest rates between Nov2019 and Aug2023 -- however, in the past 21 months real interest rates have been positive (old Tweet thread dated 14Jun2020).
Data sources are Reserve Bank of India, MOSPI, CCIL India and author.
--------------------------------------------------------------
Update 13Jun2025: Chart 46:
India CPI Inflation : India consumer price inflation data:
The
following chart shows: cumulative CPI inflation numbers for the
past 10, five and three years,
The
cumulative data will give you a new perspective on how much consumers
have suffered over the years, instead of just looking at one-year
numbers.
The
data shown in the chart are for the past 15 months -- cumulative data
for 10, 5 and 3 years are given. Year-on-year CPI inflation is also
included in the chart.
For the month of May2025, one-year CPI inflation
declined to 2.8 per cent (lowest since Feb2019) from 3.2 per cent in Apr2025, due mainly to
deceleration in food and fuel prices. The inflation has shown a marked
decline in the past six months.
India's central bank, RBI, cut
repo rate by 50 basis points on 06Jun2025 (following 25 basis point cuts both in Feb2025 and Apr2025). On 06Jun2025, it had cut cash reserve ratio or CRR by 100 basis points, to be implemented in four stages. It has also been injecting liquidity into the banking
system through OMO purchases and Forex swaps in the past six months.
As of May2025, the cumulative inflation for the past 10, five and three years is 58.7, 27.9 and 12.4 per cent respectively.
--------------------------------------------------------------
Update 21Apr2025: Chart 45:
How Rates and Ratios are Moving : (old blog dated 26May2022)
The
following chart provides data on key interest rates and ratios of
interest rate market in India. The rates and ratios range from CPI
inflation, Policy repo rate, lending and deposit rates, short-term rates
such as call money and Treasury bill yields, long term bond yields and
government-administered small savings rates of PPF, NSC and post office
deposit rates.
By looking at data over medium and long periods, one can glean some insights. The data presented here are as of 31Mar2025.
In the past four months, RBI cut CRR by 25 basis points to 4 per cent; while the LAF repo rate was cut by 50 basis points (two times, once in Feb2025 by 25 basis points and again in Apr2025 by another 25 basis points). Further the monetary policy stance was shifted from 'neutral' to 'accommodative,' in Apr2025 policy.
In addition, the RBI has been injecting huge liquidity into the banking system through variable auctions, OMO purchases and forex swaps. This is in response to declining CPI inflation and lower inflationary expectations after economic growth moderated in India in the past two quarters.
As on 31Mar2025, real interest rate (the excess of repo rate above CPI inflation) climbed to 2.91 per cent -- which is likely to fall next month as the RBI cut repo rate this month.
Even though the CPI inflation has fallen in the past one year, there has been practically no change in lending rates of banks, while there is slight decline in deposit rates in the past one year.
In response to RBI cutting repo rate this month, many banks in India have reduced their fixed deposit rates as well as savings bank interest rates -- banks in India act like an oligopoly due to lack of competition in the banking sector.
In the past one year, call money rates, treasury bill yields and 10-year G-Sec bond yield have come down in response to downward interest rate path in the economy.
There has been no change in small savings interest rates in the past six quarters.
--------------------------------------------------------------
Update 16Apr2025: Charts 43 to 44:
India CPI Inflation : India consumer price inflation data:
The following two charts show: 1) cumulative CPI inflation numbers for the past 10, five and three years, and 2) Annual CPI inflation / CPI data for the past 12 years.
The
cumulative data will give you a new perspective on how much consumers
have suffered over the years, instead of just looking at one-year
numbers.
The
data shown in the chart are for the past 15 months -- cumulative data
for 10, 5 and 3 years are given. Year-on-year CPI inflation is also
included in the chart.
For the month of Mar2025, one-year CPI inflation declined to 3.3 per cent from 3.6 per cent in Feb2025, due mainly to deceleration in food and fuel prices. The inflation has shown a marked decline in the past four months.
India's central bank, RBI, cut
repo rate by 25 basis points on 09Apr2025 (after a 25 bp cut in Feb2025). It has also been injecting liquidity into the banking
system through OMO purchases and Forex swaps in the past four months.
As of Mar2025, the cumulative inflation for the past 10, five and three years is 59.7, 29.2 and 14.5 per cent respectively.
Annual CPI inflation data show that inflation for FY 2021–22 stood at 7.0 per cent. Since then, it has followed a declining trend, reaching 3.3 per cent in FY 2024–25. The chart also shows CPI combined data for the past 12/13 years.
--------------------------------------------------------------
Update 13Mar2025: Chart 42:
Real interest rates in India: (old blog
dated 05Aug2021) Real interest rate in India for the month of Feb2025
rose to 2.64 per cent (7-month high) versus 2.24 per cent in Jan2025, as India's CPI
inflation declined to 3.6 per cent, while the RBI cut
LAF Repo rate by 25 basis points to 6.25 per cent on 07Feb2025.
Real interest rate equals LAF repo rate minus CPI inflation.
CPI inflation and India 10-year G-Sec yield data too have been included in the below chart for comparison purposes.
It may be recalled Indian savers
suffered negative real interest rates between Nov2019 and Aug2023 -- however, in the past 16 months real interest rates have been positive (old Tweet thread dated 14Jun2020).
Data sources are Reserve Bank of India, MOSPI, CCIL India and author.
--------------------------------------------------------------
Update 13Mar2025: Chart 41:
India CPI Inflation : India consumer price inflation data:
The following is a chart that shows cumulative CPI inflation numbers for the past 10, five and three years.
The
cumulative data will give you a new perspective on how much consumers
have suffered over the years, instead of just looking at one-year
numbers.
The
data shown in the chart are for the past 15 months -- cumulative data
for 10, 5 and 3 years are given. Year-on-year CPI inflation is also
included in the chart.
For the month of Feb2025, one-year CPI inflation declined to 3.6 per cent from 4.3 per cent in Jan2025, due mainly to deceleration in food and fuel prices.
The low Feb2025 inflation print is comfortable for the RBI which has cut repo rate and CRR recently, while injecting liquidity into the banking system through OMO purchases and Forex swaps in the past three months.
As of Feb2025, the cumulative inflation for the past 10, five and three years is 60.8, 29.1 and 15.9 per cent respectively.
--------------------------------------------------------------
Update 08Mar2025: Charts 39 to 40:
How Rates and Ratios are Moving : (old blog dated 26May2022)
The
following chart provides data on key interest rates and ratios of
interest rate market in India. The rates and ratios range from CPI
inflation, Policy repo rate, lending and deposit rates, short-term rates
such as call money and Treasury bill yields, long term bond yields and
government-administered small savings rates of PPF, NSC and post office
deposit rates.
By looking at data over medium and long periods, one can glean some insights.
During Oct-Dec2024 quarter, the RBI reduced cash reserve ratio or CRR by 50 basis points from 4.50 per cent to 4.00 per cent; and RBI has been injecting liquidity into the banking system through government bond purchase (OMO purchases) and forex swaps.
CPI inflation moderated a bit, while WPI inflation has inched up during the Oct-Dec2024 quarter. During the quarter, there is not much movement in other rates, like, call money, T-bill yields, 10-year G-Sec yield and term deposit rates.
There
have been no changes in interest rates of Post Office savings schemes (NSC, PPF, post
office term deposit rates, etc.) in the past one year. It is not clear
why Govt of India has not been changing these interest rates as per the
market rates. (Reference: RBI WSS data weblink)
Observations from movement in 5-year data between Dec2019 to Dec2024:
1) As policy repo rate increased from 5.15% to 6.5% during the period, real interest rate turned positive at 1.28 per cent now from negative 2.20 per cent as at the end of Dec2019
2) While call money rates and Treasury bill yields have gone up substantially, savings bank deposit rates have decreased significantly during the five year period
3) In line with increase in call money rates and T-bill yields, liquid fund returns have improved in the past five years
4) While the 10-year G-Sec yield has gone up slightly, the government's small savings interest rates (NSE 5-year and PPF) have been reduced substantially in the observation period
5) This proves the point that small savings interest rates (like, NSC 5-year and PPF) have no relation to the market rates; PM Modi government's decision to reduce PPF and NSC interest rates substantially have harmed small depositors and old people
6) Only liquid fund returns are market-determined; but not savings bank (SB) interest rates and government's small savings rates (despite the dishonest claims by the government)
Data charts include quarterly data (Dec2022 to Dec2024) as well as yearly data (Dec2018 to Dec2024).
--------------------------------------------------------------
Update 21Jan2025: Charts 36 to 38:
India Banking Infrastructure: ATMs, Debit cards and Credit cards: (Data from RBI and author)
The following three
charts shows number of outstanding ATMs, CRMs, debit cards and credit
cards as at the end of every December for the past five years. They also show value of credit and debit card transactions in India.
Outstanding number of ATMs, debit and credit cards:
ATMs are automated teller machines and CRMs are cash recycling machines. Micro ATMs are devices used by business correspondents of banks to deliver basic banking services to customers.
Micro ATMs are portable and handheld card-reading devices and can be used to dispense cash to customers in remote locations where hole-in-the-wall ATMs are not available.
The data pertain to all banks in India, namely, public sector banks (PSBs), private sector banks (PVBs), foreign banks in India, payment banks and small finance banks (SFBs).
Practically, there is no growth in number of ATMs and CRMs with banks in India in the past five years. However, the annual growth in micro ATMs is huge at 23.1 per cent in the past five years.
As of Dec2024, there are 2.14 lakh ATMs and CRMs, 14.67 lakh micro ATMs, 1,080 lakh credit cards and 9,910 lakh debit cards.
While annual growth in credit card numbers is 14.3 per cent, the growth in debit cards is tepid at 4.2 per cent in the past five years. However, the outstanding debit cards are more than nine times those of total outstanding credit cards.
Value of credit and debit card transactions during December:
Due to the so-called Digital India policies of the Indian government, there is tremendous growth in the digital transactions in India in the past five years.
Online merchant transactions have exploded. More transactions have been taking place using UPI (Unified Payment Interface) mechanism, whiles usage of debit cards by bank customers has dwindled (debit cards are primarily used for ATM cash withdrawals by customers).
The big surge in UPI transactions has negatively impacted merchant transactions through debit cards. The negative impact of UPI on credit cards is less severe compared to debit card transactions, as the five-year data presented below show.
However, the five-year annual growth of credit cards is 14.3 per cent, the growth in debit cards is just 4.2 per cent. The higher growth in credit card numbers may have lessened the impact of UPI on the value of credit card transactions.
Customers' usage of credit and debit cards includes point of sale (PoS) transactions, online merchant transactions for e-commerce and ATM cash withdrawals.
ATM withdrawals are meagre via credit cards, compared to debit cards. Of the total value of debit card transactions, ATM cash withdrawals account for more than 80 per cent of the total.
With debit cards, value of PoS transactions is more than double that of online / e-commerce. But with credit cards, value of online / e-commerce transactions is much higher versus PoS transactions.
Overall, total value of transactions of PoS and online / e-commerce are higher for credit cards compared to debit cards -- ignoring ATM cash withdrawals.
As the number of credit cards grew by 33 per cent in the passt two years, the total value of credit card transactions has gone up by an annual growth 21.9 per cent between Dec2022 and Dec2024. During the month of Dec2024, the credit card transactions amount to Rs 1.89 lakh crore.
One interesting thing is: While the total value of PoS and online / e-commerce transactions via debit cards has shown a huge decline between Dec2022 and Dec2024, the growth in the value of PoS and online / e-commerce transactions via credit cards is showing a huge growth (see tables below).
The analysis above has implications for some of the listed companies, in India, such as:
SBI Cards & Payment Services Ltd
CMS Info Systems
AGS Transact Technologies
Radiant Cash Management Services

--------------------------------------------------------------
Update 14Jan2025: Chart 35:
Real interest rates in India: (old blog
dated 05Aug2021) Real interest rate in India for the month of Dec2024 rose to 1.28 per cent versus 1.02 per cent in Nov2024, as India's CPI
inflation declined to 5.2 per cent, while the
LAF Repo rate remained at the same level of 6.50 per cent since 08Feb2023.
Real interest rate equals LAF repo rate minus CPI inflation.
CPI inflation and India 10-year G-Sec yield data too have been included in the below chart for comparison purposes.
One-year term deposit rates offered by banks in India have been stagnant in the past one year -- indicating weak monetary policy transmission in India and lack of competition among banks.
It may be recalled Indian savers
suffered negative real interest rates between Nov2019 and Aug2023 -- however, in the past 16 months real interest rates have been positive (old Tweet thread dated 14Jun2020).
Data sources are Reserve Bank of India, CCIL India and author.
--------------------------------------------------------------
Update 14Jan2025: Chart 34:
India CPI Inflation : India consumer price inflation data:
The following is a chart that shows cumulative CPI inflation numbers for the past 10, five and three years.
The
cumulative data will give you a new perspective on how much consumers
have suffered over the years, instead of just looking at one-year
numbers.
The
data shown in the chart are for the past 15 months -- cumulative data
for 10, 5 and 3 years are given. Year-on-year CPI inflation is also
included in the chart.
For the month of Dec2024, one-year CPI inflation declined to 5.2 per cent from 5.5 per cent in Nov2024, due mainly to deceleration in food prices.
The Dec2024 inflation print is within the RBI monetary policy target range of
2-6 per cent.
As of Dec2024, the cumulative inflation for the past 10, five and three years is 63.7, 29.9 and 17.6 per cent respectively.
--------------------------------------------------------------
Update 05Jan2025: Charts 30 to 33:
AMFI List: Classification of Indian stocks by market capitalization: To be followed by Equity Mutual Funds or EMFs (old blog dated 17Feb2024 / Tweet thread 05Jan2023)
In October 2017, India's capital market regulator Securities and Exchange Board of India (SEBI) categorized mutual fund schemes into six categories, like, equity schemes, debt schemes, hybrid schemes and so on -- with a view to providing clear distinction and uniformity, in terms of asset allocation and investment strategy, to mutual fund plans.
SEBI's broad idea is investors, while assessing various mutual fund plans, should be able to properly understand the plans in terms of similarity of plans and uniformity of their characteristics.
When SEBI says a certain percentage of total assets has to be invested in large- or mid- or small-cap stocks, SEBI needs to define what these stocks are. Hence, SEBI decided to define stocks on the basis of their market capitalisation as follows:
1) large-cap stocks: 1st to 100th company in terms of full market capitalization
2) mid-cap stocks: 101st to 250th company in terms of full market capitalization
3) small-cap stocks: 251st company onwards in terms of full market capitalization
In order to adhere to SEBI's definition of stocks my market capitalization, Association of Mutual Funds in India (AMFI) prepares a list of all listed stocks (more than 5,000 in number) based on their average market capitalisation and publishes the list of large-, mid- and small-cap stocks as per SEBI definition.
AMFI is an industry body representing all mutual fund companies in India.
AMFI prepares the list two times in a year, that is, at the end of June and December of every year. AMFI publishes the list within five calendar days from the end of the six-month period. Once the list is updated by AMFI, mutual funds need to rebalance their portfolios as per the updated list, within a period of one month.
The below charts provide data as published by AMFI for the half-yearly period (based on average market capitalization of stocks during Jul-Dec2024) ended 31Dec2024:
Chart 30: Snapshot of AMFI classification of stocks by market cap:
Chart 31: Half-yearly and yearly changes in market caps of listed stocks as of 31Dec2024:
As per data ending 31Dec2024, all publicly traded stocks with an average market cap of more than Rs 100,000 crore will be classified as large-cap stocks; the market cap showed a growth of 18.7% over the average market cap of Rs 84,300 crore over the earlier half-yearly period.
But large-cap stock market cap, as on 31Dec2024, showed a growth of 49.4% in the past one year.
The growth rate can be checked in the chart for mid- and small-cap stocks.
Chart 32: Percentage change in market cap for large-, mid- and small-cap stocks since SEBI introduced the concept of stock classification by market cap:
Since the introduction of SEBI, the average minimum market cap of a large-cap has grown by a staggering 242% (that is, between Dec2017 and Dec2024).
The average minimum market cap for mid-cap stocks shows a huge growth of 287%.
The phenomenal growth in market caps partially reflects investor fancy towards Indian stock market.
Chart 33: The movement of average market cap for the past six years, from 31Dec2019 till 31Dec2024:
--------------------------------------------------------------
Update 16Dec2024: Chart 29:
QIP funds raised by India Inc: (Tweet thread 16Dec2024):
Data from FY 2006-07 to FY 2024-25 >
During the financial year 2024-25 (data for 8 months till 30Nov2024), India Inc raised funds worth Rs 1.12 lakh crore via QIPs or qualified institutional placements (equity capital).
Indian media are in the habit of saying this is the "highest" QIP raised in the past 19 years. Data are available for the past 19 years. But the media don't contextualize or give any reference to the data over the years.
The data shown in the below chart are adjusted for average BSE market cap of all listed companies in India. When we adjust the QIP raised data with average BSE market cap, the picture changes.
In the past 19 years, the biggest QIP raised is in FY 2009-10, when QIP raised was 0.91 per cent of the average market cap for the financial year. Media will give only the absolute numbers, without adjusting with other metrics, like, market cap -- in the process, the data lose relevance and may lead to misinterpretation.
As data from FY 2006-07 to 2024-25 show: In 2009-10, 2007-08, 2020-21 & others, QIP as a percentage of BSE market cap is much higher compared to FY 2023-24 and 2024-25.
For example, in FY 2009-10, India Inc raised QIP of Rs 41,968 crore (0.91 per cent of market cap) when the average BSE market cap was just Rs 46.26 lakh crore. Whereas, QIP raised was Rs 62,520 crore (just 0.47 per cent of market cap) in 2017-18 when average BSE market cap was Rs 131.90 lakh crore -- though absolute QIP number is higher.
Take another example: in both FY 2014-15 & 2021-22, the QIP raised is nearly the same at Rs 28,500 crore.
But in 2014-15, the Sensex and BSE market cap are much lower -- hence, the amount raised is nearly three times in 2014-15, when compared to 2021-22.
Don't believe the nonsense of absolute numbers.
Media always give you absolute numbers, without giving any context or background.
Just because data points are available, don't quote them or believe in them.
Question the data and do your own research.
--------------------------------------------------------------
Update 03Dec2024: Charts 24 to 28:
EPFO Investments in Equity ETFs: (Old blog dated 18Mar2023):
Employees'
Provident Fund Organisation (EPFO) is a statutory body established by
the Government of India. EPFO collects, administers and manages
provident funds and pension funds of various employees in India.
EPFO invests in debt securities and equity exchange traded funds (ETFs).
According to a PIB press release on 02Dec2024, in FY 2024-25 (till Oct2024), EPFO invested Rs 34,208 crore in equity ETFs; as against Rs 57,184 crore invested for the entire FY 2023-24. Since August 2015,
EPFO's gross investments (does not include redemptions) in equity ETFs amount to Rs 325,900 crore till 31Oct2024. This is just face value of the gross
investments made by EPFO.
Due to significant amounts being invested by EPFO in Indian equities since 2015 and rising investments by mutual funds in India in recent years, the dominance of domestic institutional institutions (DIIs) has increased. The flow of money from DIIs has been acting as a counterweight to FPIs or foreign portfolio investors in the Indian stock market. The share of FPIs in Indian equities (FPI AUC) has progressively come down from 19.5 per cent in Mar2017 to 16.4 per cent in Sep2024.
The total corpus of various funds managed by EPFO is Rs 24.76 lakh crore, of which equity ETF investments are Rs 2.35 lakh crore as on 31Mar2024. Equity ETFs alone account for just 9.5 per cent of the total EPFO corpus.
Total AUM of ETFs (includes debt and equity ETFs, but excludes gold ETFs) in India is Rs 7.83 lakh crore as on 31Oct2024. It swelled phenomenally from a level of just Rs 6,700 crore as on 31Dec2014.
EPFO has invested only in six equity ETFs. The total AUM of these six equity ETFs is Rs 4.89 lakh crore. Only these six ETFs (due to heavy investments by EPFO) account for a staggering 72.6 per cent of the total AUM of 169 equity ETFs in India as of 31Oct2024.
The groundwork for EPFO investments in equity ETFs was initiated in 2013 by the then finance minister, P Chidambaram in his 2013-14 budget speech (for more on this, see old blog).
Charts:
EPFO Investments in Equity ETFs: 2015 to 2024
Total corpus of various funds managed by EPFO
Total assets of ETFs in India (excluding gold ETFs)
AUM of six ETFs in which EPFO invested
Timeline of EPFO Equity Investment Pattern
--------------------------------------------------------------
Update 01Dec2024: Chart 23:
India GDP quarterly growth rates: Real GDP and Nominal GDP Growth Rates %: Data from Apr-Jun2023 to Jul-Sep2024 Quarter:
India real GDP growth rate for the Jul-Sep2024 quarter (Q2) fell to 5.4 per cent, which is almost a two-year low, as per data released by MOSPI, Govt of India on 29Nov2024.
As can be seen from the chart below, absolute real GDP fell from Rs 47.24 lakh crore in Jan-Mar2024 quarter to Rs 43.64 lakh crore in Apr-Jun2024 quarter, though it slightly increased in the Jul-Sep2024 quarter.
Even absolute nominal GDP figures have been falling for the past two quarters. It declined from Rs 78.28 lakh crore (Jan-Mar2024) to Rs 77.31 lakh crore (Apr-Jun2024) and further to Rs 76.60 lakh crore (Jul-Sep2024).
India follows an April to March financial year.
--------------------------------------------------------------
Update 30Nov2024: Chart 22:
Growth in Gold loans (loans against gold jewellery):
Gold loans grew by 43.4 per cent from Rs 1.03 lakh crore in Mar2024 to Rs 1.47 lakh crore in Sep2024, as per RBI data (please check RBI monthly bulletins and RBI DBIE for data).
In Mar2024, gold loans outstanding stood at 1.9 per cent and it has risen to 2.6 per cent by Sep2024. The sharp growth in gold loans has raised concerns in India about rising indebtedness of households indicating potential economic distress and strain in the economy.
Gold loans were 1.1 per cent of personal loans in Mar2019 and 2.5 per cent in Mar2021 (COVID-19 effect -- during COVID-19 Pandemic, households borrowed heavily to meet essential hospitalisation charges and medical bills).
Data of gold loans outstanding prior to 2019 is not available in RBI DBIE.
Data from 2019 to 2024 >
--------------------------------------------------------------
Update 19Nov2024: Chart 21:
Mutual Fund Assets: Growth of India's Mutual Fund Industry: A Key Contributor to Economic Expansion (For a detailed analysis, please refer to the blog dated 18Jul2024)
The remarkable upsurge in the size of India's Mutual Fund (MF) industry is playing a pivotal role in the growth of the Indian economy, particularly in fostering the democratisation of finance. However, there remain significant challenges within the industry’s culture that need attention.
In the 2024-25 financial year, India's mutual fund industry experienced an impressive 26 per cent growth in assets under management (AUM), based on data available through Oct2024.
The industry's total assets surged from Rs 53.40 lakh crore on 31Mar2024 to Rs 67.26 lakh crore by 31Oct2024, reflecting robust investor participation and growing confidence in mutual funds as an investment vehicle.
Growth from 2013 to 2024 >
--------------------------------------------------------------
Update 19Nov2024: Chart 20:
Real interest rates in India: (old blog
dated 05Aug2021) Real interest rate in India for the month of Oct2024
fell to 0.29 per cent versus 1.01 per cent in Sep2024, as India's CPI
inflation soared to 6.2 per cent, which is a 14-month high, while the
LAF Repo rate remained at the same level.
In fact, LAF Repo rate has been at 6.50 per cent since 08Feb2023. Real interest rate equals LAF repo rate minus CPI inflation.
One-year term deposit rates offered by banks in India have been stagnant in the past one year -- indicating weak monetary policy transmission in India and lack of competition among banks.
Real interest rate plummeted to 0.29 per cent in Oct2024, while the one-year high was 2.90 per cent in Jul2024. It may be recalled Indian savers suffered negative real interest rates between Nov2019 and Aug2023 -- however, in the past 14 months real interest rates have been positive (old Tweet thread dated 14Jun2020).
Data sources are Reserve Bank of India, CCIL India and author.
--------------------------------------------------------------
Update 19Nov2024: Chart 19:
India CPI Inflation : India consumer price inflation data:
The following is a chart that shows cumulative CPI inflation numbers for the past 10, five and three years.
The
cumulative data will give you a new perspective on how much consumers
have suffered over the years, instead of just looking at one-year
numbers.
The
data shown in the chart are for the past 14 months -- cumulative data
for 10, 5 and 3 years are given. Year-on-year CPI inflation is also
included in the chart.
For the month of Oct2024, one-year CPI inflation soared to 6.2 per cent from 5.5 per cent in Sep2024, led by food prices.
With 6.2 per cent for Oct2024, consumer price inflation reached 14-month high; the print is also outside the RBI monetary policy target range of 2-6 per cent.
The higher print for CPI of 6.2 per cent is mainly due to higher food prices (food inflation at 10.87 per cent), which accounts for almost 50 per cent of India's CPI basket.
As of Oct2024, the cumulative inflation for the past 10, five and three years is 63.9, 33.7 and 18.9 per cent respectively.
--------------------------------------------------------------
Update 10Nov2024: Chart 18:
How Rates and Ratios are Moving : (old blog dated 26May2022)
The
following chart provides data on key interest rates and ratios of
interest rate market in India. The rates and ratios range from CPI
inflation, Policy repo rate, lending and deposit rates, short-term rates
such as call money and Treasury bill yields, long term bond yields and
government-administered small savings rates of PPF, NSC and post office
deposit rates.
By looking at data over medium and long periods, one can glean some insights.
In the past three months (between end-Jun2024 and end-Sep2024), there have been no changes in policy rates and ratios of RBI, though during
the MPC (Monetary Policy Committee) meeting on 09Oct2024, RBI changed the monetary
policy stance to 'neutral' from earlier 'withdrawal of accommodation.'
CPI and WPI inflation have been all over the place while the RBI has kept policy rates and ratios unchanged since Jun2022.
Between end-Jun2024 and end-Sep2024, short term interest rates (call money rates and T-Bill rates) have fallen. Even 10-year G-Sec benchmark yield has come down.
There have been no changes in Post Office savings schemes (NSC, PPF, post office term deposit rates, etc.) in the past one year. It is not clear why Govt of India has not been changing these interest rates as per the market rates. (Reference: RBI WSS data weblink)
--------------------------------------------------------------
Update 18Oct2024: Chart 17:
India CPI Inflation : India consumer price inflation data:
The following is a chart that shows cumulative CPI inflation numbers for the past 10, five and three years.
The
cumulative data will give you a new perspective on how much consumers
have suffered over the years, instead of just looking at one-year
numbers.
The
data shown in the chart are for the past 14 months -- cumulative data
for 10, 5 and 3 years are given. Year-on-year CPI inflation is also
included in the chart.
For the month of Sep2024, one-year CPI inflation jumped to 5.5 per cent from 3.7 per cent in Aug2024, led by food prices.
As of Sep2024, the cumulative inflation for the past 10, five and three years is 61.7, 33.2 and 19 per cent respectively.
--------------------------------------------------------------
Update 22Sep2024: Chart 16:
India CPI Inflation : India consumer price inflation data:
The following is a chart that shows cumulative CPI inflation numbers for the past 10, five and three years.
The
cumulative data will give you a new perspective on how much consumers
have suffered over the years, instead of just looking at one-year
numbers.
The
data shown in the chart are for the past 13 months -- cumulative data
for 10, 5 and 3 years are given. Year-on-year CPI inflation is also
included in the chart.
For example, as at the end of Aug2024, the cumulative inflation for the past 10, five and three years is 60.4, 33.1 and 18.5 per cent respectively.
The cumulative inflation shows a mixed trend in the past five to six months -- slowing in some months and rising again later.
--------------------------------------------------------------
Update 17Aug2024: Chart 15:
How Rates and Ratios are Moving : (old blog dated 26May2022)
The following chart provides data on key interest rates and ratios of interest rate market in India. The rates and ratios range from CPI inflation, Policy repo rate, lending and deposit rates, short-term rates such as call money and Treasury bill yields, long term bond yields and government-administered small savings rates of PPF, NSC and post office deposit rates.
By looking at data over medium and long periods, one can glean some insights.
In the past six months, policy rates of India's central bank (Reserve Bank of India or RBI) have remained stable, while inflationary pressures have ebbed a little. In the same period, long-term bond yields have fallen while the government has kept small savings interest rates stagnant.
It's strange banks have been raising their lending rates (Tweet / X Post thread dated 01Aug2024) while inflationary pressures have somewhat eased and RBI has kept policy rates the same as before.
One excuse for banks raising lending rates is their inability to raise deposits from the public -- because of which their cost of deposits has gone up a bit. Bank credit growth has outpaced deposit growth rate, keeping banks scrambling for deposits.
Despite tall claims by RBI, monetary policy transmission (MPT) has been weak in India and the channels available are not very effective -- in the process the interests of common citizens are jeopardised.
Chart: How Rates and Ratios are Moving: Quarterly date from Jun2022 to Jun2024 (for older data, please check blog dated 26May2022) >
(please click on the image for a better view)
--------------------------------------------------------------
Update 12Aug2024: Chart 14:
India CPI Inflation : India consumer price inflation data:
The following is a chart that shows cumulative CPI inflation numbers for the past 10, five and three years.
The
cumulative data will give you a new perspective on how much consumers
have suffered over the years, instead of just looking at one-year
numbers.
The
data shown in the chart are for the past 14 months -- cumulative data
for 10, 5 and 3 years are given. Year-on-year CPI inflation is also
included in the chart.
For example, as at the end of Jul2024, the cumulative inflation for the past 10, five and three years is 61.8, 33.8 and 18.7 per cent respectively.
The fact that one-year CPI inflation for Jul2024 fell to 3.5 per cent is a statistical illusion because the base of Jul2023 was high (please check Jul2023 inflation was a staggering 7.4 per cent).
--------------------------------------------------------------
Update 22Jul2024: Charts 12 and 13:
Total Assets of National Pension System (NPS): Total assets under management (AUM) of NPS, including those of Atal Pension Yojana (APY) are Rs 11.73 lakh crore as on 31Mar2024. As on 30Jun2024, the total AUM is Rs 12.48 lakh crore.
To get a perspective, it may be mentioned the AUM of MF industry as on 30Jun2024 is Rs 61.2 lakh crore, which is almost five times the AUM of NPS.
During FY 2023-24, NPS assets grew by 30 per cent. In the past five years (between Mar2019 and Mar2024), the absolute growth in NPS asset is a staggering 270 per cent.
The asset growth may be due to a combination of: addition of new subscribers, growth in assets especially equities and awareness about NPS benefits.
Of the NPS assets, the main asset classes are government securities or G-Sec (54.2 per cent of total assets), corporate bond (23.7 per cent) and equity (18.9 per cent).
The share of equity in NPS assets grew from 14 per cent in Mar2019 to almost 19 per cent in Mar2024.
There are 11 pension fund managers (PFMs) registered under NPS. The top five PFMs by assets, as on 31Mar2024, are SBI Pension Fund, LIC PF, UTI PF, HDFC PF and ICICI PF. Interestingly, the top three PFMs manage over 90 per cent of NPS assets as on 31Mar2024.
Key points from interview of Deepak Mohanty, PFRDA chairman with ET Now on 19Jul2024:
- annual return for equity portion during FY 2023-24 was 36%
- since inception, the equity returns are 14% annualised
- total NPS AUM by Mar2025 may be around Rs 15 lakh crore
- he refused to comment about states of Himachal Pradesh,
Punjab and Rajasthan going out of NPS in recent years
Data sources for the two charts below:
Chart showing asset-wise classification of NPS:
Chart showing PFM-wise assets of NPS as on 31Mar2024:
--------------------------------------------------------------
Update 21Jul2024: Chart 11:
Real interest rates in India: (old blog dated 05Aug2021) Real interest rate in India for the month of Jun2024 fell to 1.42 per cent versus 1.75 per cent in May2024, as India's CPI inflation moved above 5 per cent after a gap of three months, while the LAF Repo rate remained at the same level.
In fact, LAF Repo rate has been at 6.50 per cent since 08Feb2023. Real interest rate equals LAF repo rate minus CPI inflation.
One-year term deposit rates offered by banks in India have been stagnant in the past one year -- indicating weak monetary policy transmission in India and lack of competition among banks.
Real interest rate currently is slightly lower compare to 1.63 per cent in Jun2023. It may be recalled Indian savers suffered negative real interest rates between Nov2019 and Aug2023 -- however, in the past 10 months real interest rates have been positive (old Tweet thread dated 14Jun2020).
Data sources are Reserve Bank of India, CCIL India and author.
--------------------------------------------------------------
Update 21Jul2024: Charts 9 and 10:
Mutual Fund Assets: Growth of India's Mutual Fund Industry: Upsurge in asset size of India's Mutual Fund industry is contributing to the growth of the Indian economy, especially in democratisation of finance; though the MF industry's culture leaves a lot to be desired.
During the
financial year 2023-24, total assets of India's mutual fund industry
grew by 35 per cent. The total assets under management (AUM) grew from
Rs 39.4 lakh crore as on 31Mar2023 to Rs 53.4 lakh crore as on
31Mar2024 (Please see blog dated 18Jul2024 for more details).
Growth from 2013 to 2024 >
Growth from 2000 to 2012 >
--------------------------------------------------------------
Update 12Jul2024: Chart 8:
India CPI Inflation : India consumer price inflation data:
The following is a chart that shows cumulative CPI inflation numbers for the past 10, five and three years.
The
cumulative data will give you a new perspective on how much consumers
have suffered over the years, instead of just looking at one-year
numbers.
The
data shown in the chart are for the past 14 months -- cumulative data
for 10, 5 and 3 years are given. Year-on-year CPI inflation is also
included in the chart.
For example, as at the end of Jun2024, the cumulative inflation for the past 10, five and three years is 63, 33.1 and 17.9 per cent respectively.
--------------------------------------------------------------
Update 04Jul2024: Charts 5 to 7:
India GNI per capita as per World Bank : India's per capita national income, in current US dollars, grew by 5.8 percent in 2023 to 2,540, as per latest data from World Bank (related blog dated 15Nov2023).
India's rank as per capita GNI in current US dollars (Atlas method) is 148 in the world, among the 198 countries for which data is available.
Gross national
income (GNI) is the total income earned by a nation’s residents and businesses irrespective of where it is
earned. It can be calculated by adding income from foreign countries to country’s
gross domestic product (GDP).
Per capita GNI is often considered as an indicator of a nation's economic health and standard of living. Since the turn of the century, India's per capital national income in US dollars grew by an annualised rate of 7.92 per cent.
Data from 1998 to 2023: As can be observed from the chart, the period from 2003 to 2007 has seen the biggest jump in India's per capita GNI in current US dollars.
Comparison with comparable countries: Comparable
countries, like, BRICS, G20 and others are included in the chart below to see how
India performs relatively. As per World Bank’s 2023 data about per capita GNI as on 28Jun2024, India is a lower middle income country.
India's rank at 148 is below that of comparables like, Bangladesh, Egypt and Vietnam. India’s rank in per capita income is the lowest not only among the
G20 nations, but also among BRICS countries (it may be noted on a per capita purchasing power parity or PPP method, India's rank in 2023 is slightly higher at 131).
In 2023, Russia moved from an 'upper middle income' country to a 'high income' country, even though the country is at war with Ukraine.
World Bank Country Classification: World Bank divides countries into four groups by their income level. The groups are: low income, lower middle income, upper middle income and high income.
The thresholds for country classification, as on 01Jul2024 for FY 2025, are given in the below chart. The levels are as per Atlas GNI per capita in current US dollars (2023 data).
As India's per capita GNI is USD 2,540, it falls under lower middle income country. To reach the current threshold (which is likely to go up in future) of USD 4,516 for upper middle income category, it may take more than a decade for the world's most populous nation to reach the next higher income level threshold.
As per 2023 World Bank data, India's population is 142.86 crore or 1.43 billion.
--------------------------------------------------------------
Update 24Jun2024: Chart 4:
India Real GDP Growth : India real GDP growth grew by 8.2 per cent during FY 2023-24, compared to 7 per cent in 2022-23.
There is a wide gap between GDP (gross domestic product) and GVA (gross value added) numbers; the gap could be explained by higher taxes (yes, PM Modi government has been extracting more flesh from you and me) and lower subsidies (yes, they have cut subsidies affecting millions of poor people).
GDP / GVA numbers are always revised three of four times, because these are just estimates. Indian data command poor credibility.
Real GDP is derived from nominal GDP after adjusting for GDP deflator, which is derived from CPI (consumer price inflation) and WPI (wholesale price inflation).
If you could massage GDP deflator, real GDP looks high.
Economists have questioned the revised GDP methodology and the wide gap between private consumption and GDP prints.
India real GDP growth rates (base year 2011-12) from 1998-99 to 2023-24 >
--------------------------------------------------------------
Update 13Jun2024: Charts 1 to 3:
India CPI Inflation : India consumer price inflation data:


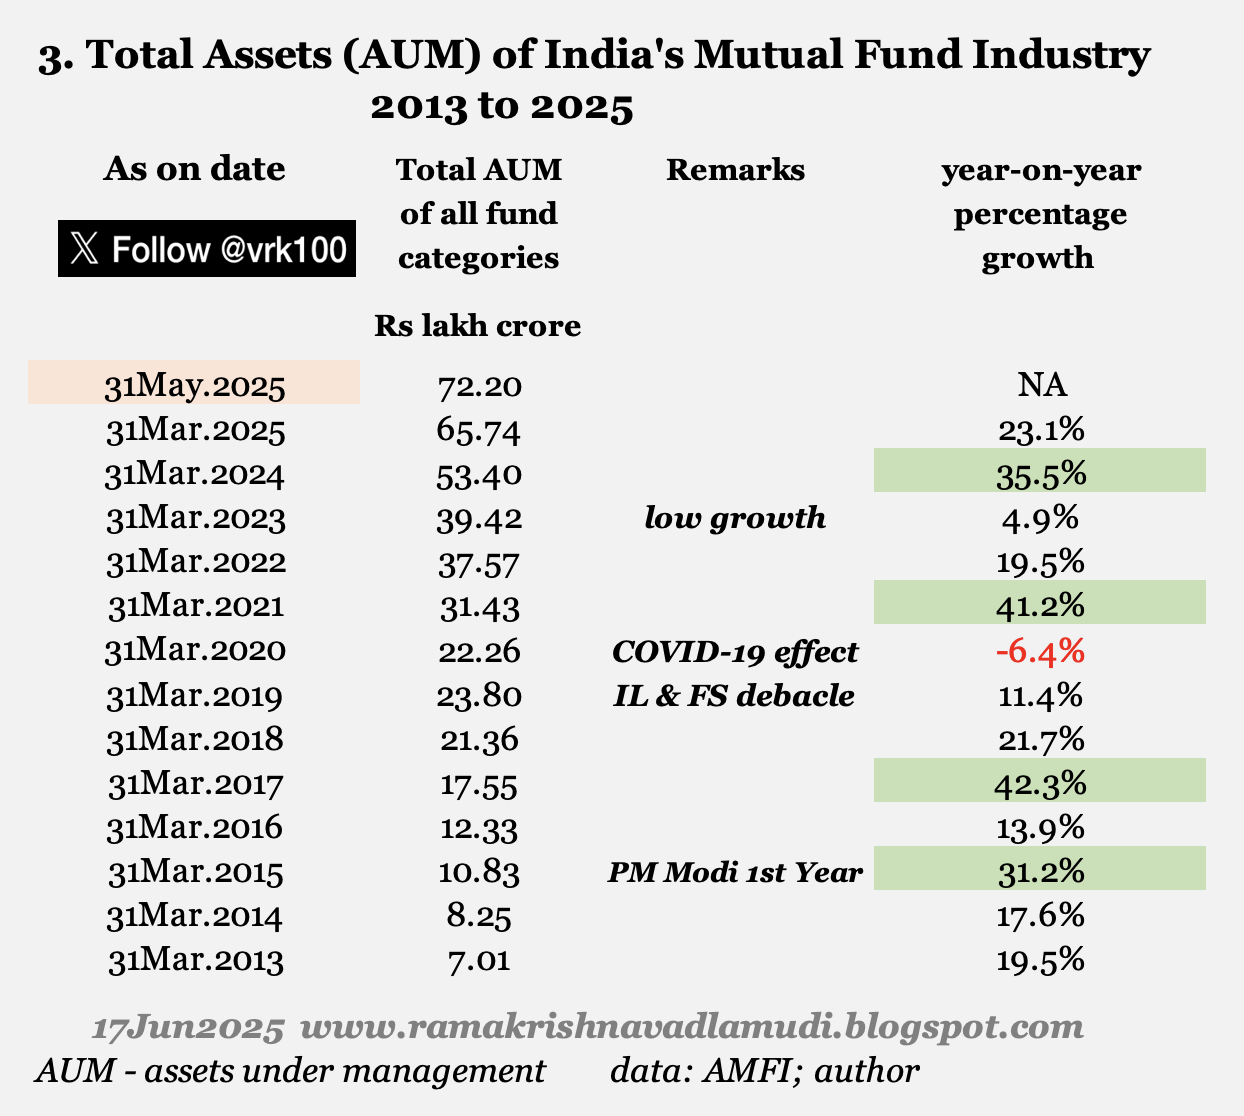


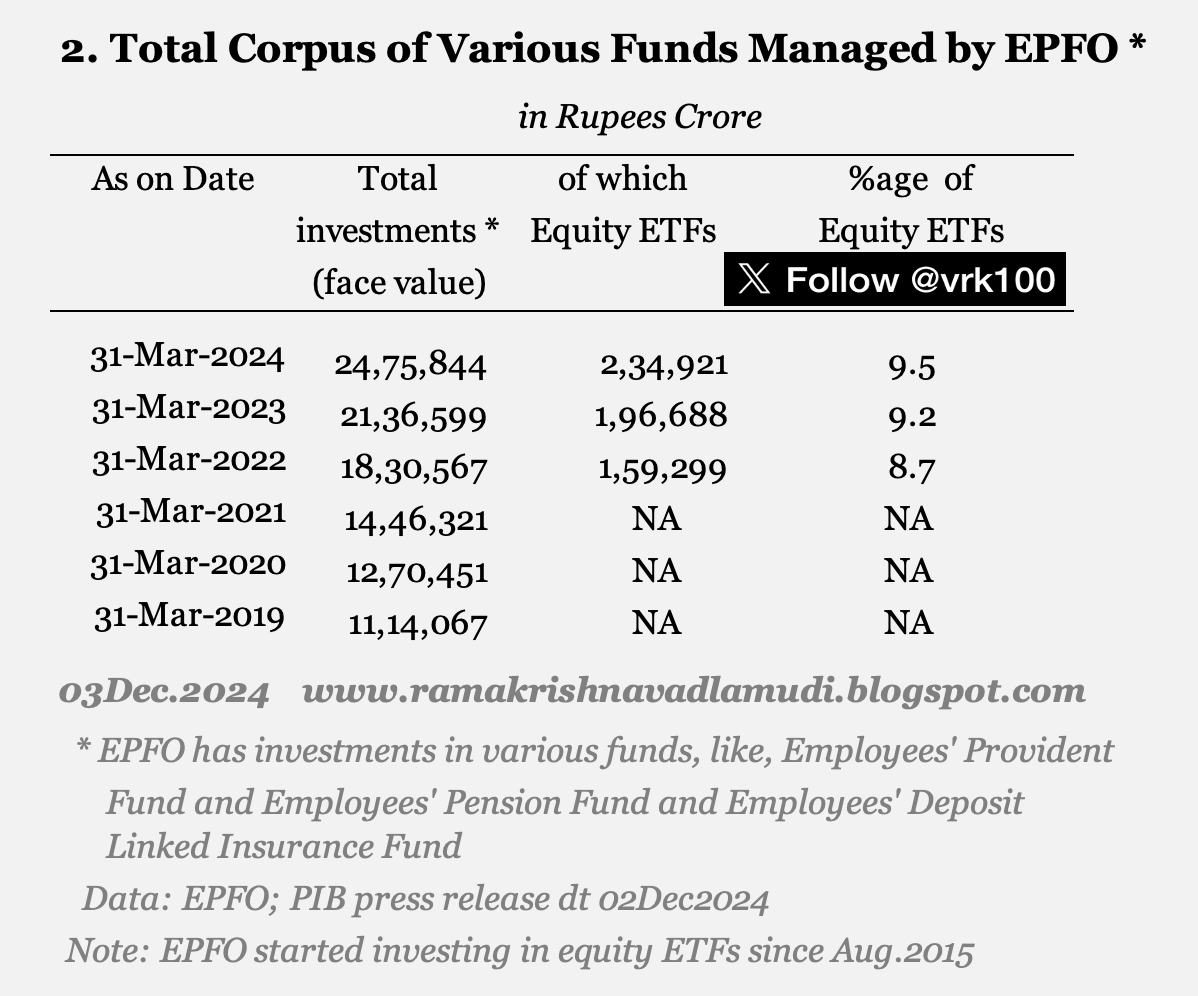


No comments:
Post a Comment