NSE Indices Calendar Year Returns: 2006 to 2024

(This
is for information purposes only. This should not be construed as a
recommendation or investment advice even though the author is a CFA Charterholder. Please consult your financial
adviser before taking any investment decision. Safe to assume the author has a vested
interest in stocks / investments discussed if any.)
While comparing stocks or equity indices, it's better to compare performance over long periods of time, rather than for short periods of time.
With passive management of equity funds getting decent traction in India, let us examine how different Nifty indices have performed over the years.
This is a follow-up blog to recent articles penned by the author in the past one week.
You can check them here:
How to Buy Nifty Midcap Index 03May2024
As mentioned in a previous blog, in the category of 'Broad Market Indices,' some key indices are:
a) Nifty 50
b) Nifty Next 50
c) Nifty 100
d) Nifty Midcap 150
e) Nifty Smallcap 250
As you may be knowing, the structure of Nifty Broad Market Indices is given below for your ready reference:

All the above five indices flow from Nifty 500 Index.
2. Nifty Indices Calendar Year Returns: 2006 to 2024
While trailing returns of the Nifty Indices (NSE Indices) are readily available (Nifty Indices Return Profile), the same is not the case with calendar year returns.
Calendar year returns too are important to understand which index has done the best in a calendar year and which fund is consistently outperforming or underperforming other indices.
Additionally, rolling returns too are important in understanding the underperformance or outperformance of indices over long periods of times. We shall discuss the same in a later article.
Table 1: Nifty Indices Calendar Year Returns: 2006 to 2024:
2024 returns are up to 31Mar2024.
(please click on the image to view better)

If a particular index has done well in a single year, the trailing returns will be overwhelmingly influenced by the returns of the latest year and could distort the 3-year, 5-year and 10-year trailing returns.
Hence, it's better to complement the trailing returns with calendar year or annual returns and rolling returns.
While Nifty Smallcap 250 index falls heavily during market downturns, it tends to rally strongly during bull markets. With small- and mid-cap indices, investors need to brace for stomach-churning volatility.
As we're human beings, we tend to sell at times of maximum pessimism and tend to buy during times of maximum euphoria.
Behaviourally, we are unable to control our emotions of greed and fear.
With large-cap indices, investors may expect lower returns overall but they come with much lower volatility as compared to mid- and small-cap indices.
So, everything boils down to your returns expectations, risk appetite, your personal situation and overall asset allocation needs.
All the data in table 1 are based on TRI or total return index (not price-based).
The base date
for both Nifty Midcap 150 and Nifty Smallcap 250 indices is 01Apr2005.
Hence, comparison is possible only from calendar year 2006 onwards.
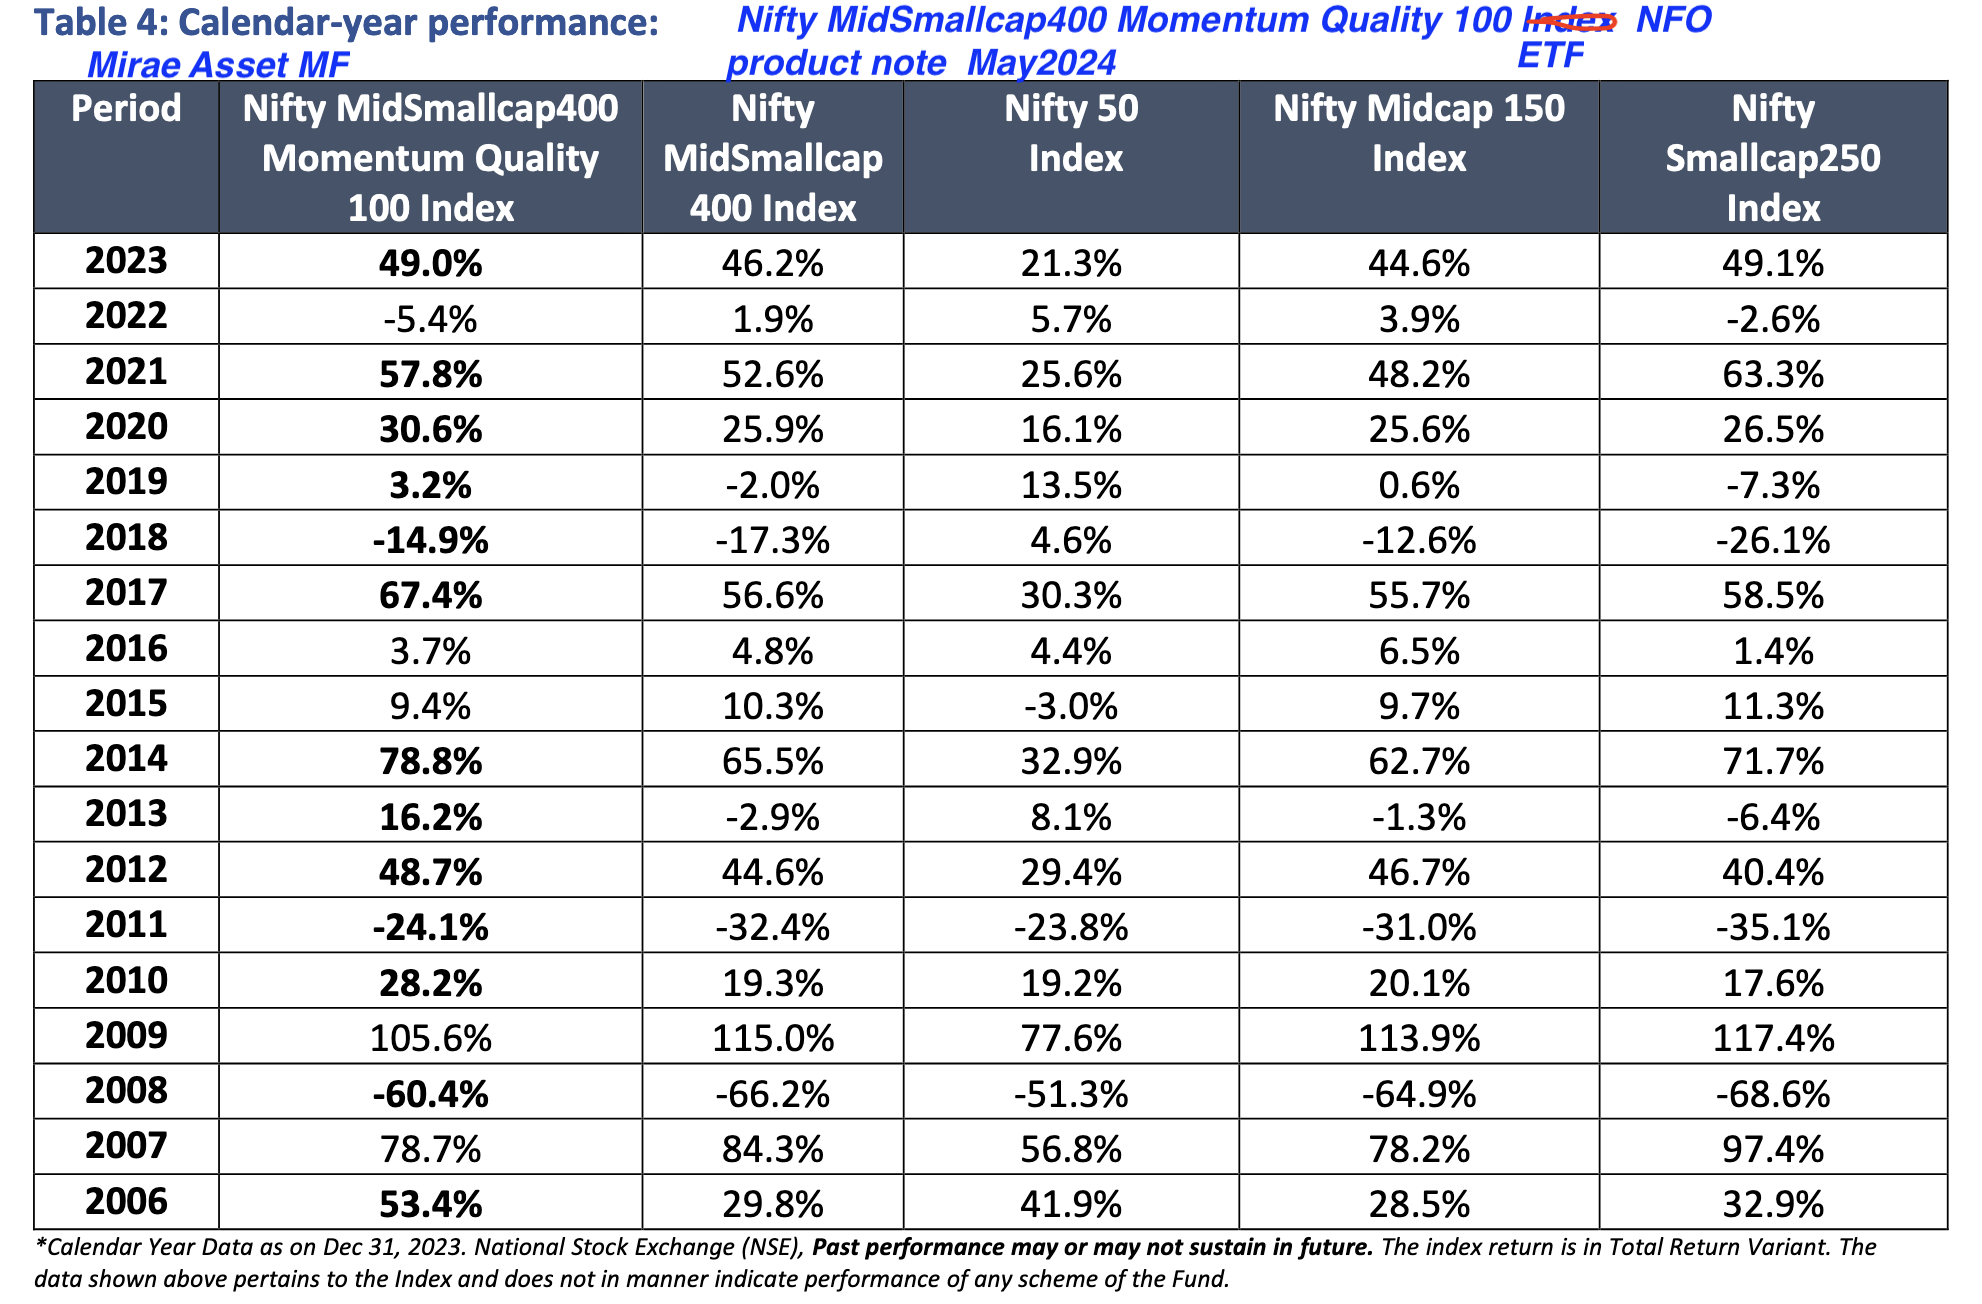
The same data as in table 1 above is presented in table 4 below, with green cells showing the best returns in a year while orange cells showing the worst returns in the same year. The results are self-explicit.

3. Nifty Indices Calendar Year Drawdowns: 2006 to 2023
In the context of investments, drawdown means how much a particular asset loses from the top of an investment value to its bottom.
For instance, in calendar year 2022, S&P 500 index dropped 25 per cent from its peak in Jan2022 to its trough in Oct2022, though it recovered later and closed with a loss of around 19 per cent for 2022.
The largest intra-year drop of 25 per cent is the maximum drawdown for S&P 500 in 2022. Simply put, how much an asset loses from its peak to trough in a year is known as drawdown.
Table 2: Nifty Indices Calendar Year Drawdowns: 2006 to 2023:

While the data in table 1 are presented for five indices, data in table 2 are for three indices only, namely, Nifty 50 TRI, Nifty Midcap 150 TRI and Nifty Smallcap 250 TRI.
As shown in table 2, Nifty Smallcap 250 has provided the worst drawdown, of the three indices, for 15 of the 18 years. It has provided the least drawdown of the three for one year (that is, 2021).
From a risk perspective, Nifty Smallcap 250 entails higher risk compared to Nifty 50 and Nifty Midcap 150. As such, the chances of losing money and the magnitude of such a loss are higher in case of Nifty Smallcap 250 -- though it tends to recover with bigger gains when market rebounds.
While Nifty Smallcap 250 has provided worst drawdown in 15 out of 18 years, Nifty 50 suffered worst drawdown only one year (2015) out of 18 years data analysed here. So, the chances of losing money and the magnitude of loss are lower for Nifty 50.
Nifty 50 index has enjoyed the least drawdown for 15 years, which is a positive factor for the index.
4. Nifty Indices Trailing Returns:

Data points are often funny. As on date, there is a wide gap between one-year returns of Nifty 50 and other indices, like, Nifty Next 50, Nifty Midcap 150 and Nifty Smallcap 250.
This has overly influenced the trailing returns of these indices -- resulting in the underperformance of Nifty 50 for all the periods, 1-year, 3-year, 5-year and 10-year, not to speak of 1-month and 3-month.
If you check the trailing return data of these indices as on 31Dec2019 and 31Dec2020, you will find completely opposite results.
As mid- and small-cap indices have done exceedingly well in the past three years (table 1 above), the trailing returns are somewhat distorted by the latest numbers.
As you know, there is no guarantee the mid- and small-cap indices would continue to do well in future too.
5. Summary
It's not a good idea to depend on a few metrics while making investment decisions. It's always better to have a comprehensive view factoring in various future scenarios, while anlaysing the past data for longer periods of time as shown above.
We should not see things in isolation. We have found, for example, Nifty 50 suffers the least drawdown (table 2). While this is positive, it comes with the attended downside of lower returns.
Investors need to decide on which side of the spectrum they are. Are you in the low risk tolerance camp or are you in the high return expectations camp?
- - -
-------------------
References and additional data:
The Milkmaid, 1660 Johannes Vermeer
NSE Index Dashboard 31Mar2024
Nifty Indices Broad Market Indices
Nifty Indices All research papers
Nifty Indices - Index factsheet
Nifty LargeMidcap 250 index research paper
Motilal Oswal Nifty 500 Index fund - PPT presentation
| MiraeAsset Nifty MidSmallcap400 Momentum Quality 100 ETF | |
Axis MF Nifty Next 50 presentation
Nifty indices return profile - trailing returns as on 03May2024

Nifty indices return profile - trailing returns as on 31Dec2020


Screenshots from MF NFO presentations and Nifty Indices research papers >


Screenshots of WhiteOak Capital Multi Cap fund presentation as on 30Apr2024 >


-------------------
Read more:
Blog of Blogs Theme-wise
How to Buy Nifty Midcap Index 03May2024
NSE Emerging Indices Comparison 31Mar2024
India Passive Funds and Their Asset Size 29Apr2024
Guide to Tracking Error of Mutual Funds 27Apr2024
Mutual Fund Asset Class Returns 31Mar2024
JP Morgan Guide to Markets 31Mar2024
Gilt funds worth considering
Global Market Data 31Mar2024
Understanding Real Sensex and Currency Debasement
Select Gilt Funds Performance
SEBI Categorization and Rationalization of Mutual Funds
AMFI List of Market Cap: Categorization of Large-, Mid- and Small-Cap Stocks
Stocks and Peer Comparison by Industry
India: Prospects and Challenges
Buyback Offers and Weblinks
Negative Impact of Debt Mutual Fund Tax Changes
Weblinks and Investing
-------------------
Disclosure: I've got a vested interest in Indian stocks and other investments. It's safe to assume I've interest in the financial instruments / products discussed, if any.
Disclaimer: The analysis and opinion provided here are only for information purposes and should not be construed as investment advice. Investors should consult their own financial advisers before making any investments. The author is a CFA Charterholder with a vested interest in financial markets.
CFA Charter credentials - CFA Member Profile
CFA Badge
Viewing Options for this blog in different formats:
He blogs at:
https://ramakrishnavadlamudi.blogspot.com/
X (Twitter) @vrk100
No comments:
Post a Comment