Monday 31 January 2022

JP Morgan Guide to the Markets Dec2021 - vrk100 - 31Jan2022

JP Morgan Guide to the Markets Dec2021


JP Morgan Asset Management publishes a comprehensive presentation every month end, containing various slides on global markets, especially those relating to the US markets.

------------------

Related Blogs: 

JP Morgan Guide to Markets Nov2021

JP Morgan Guide to Markets Aug2021

-------------------


This is a very useful and informative guide for financial market professionals or FMPs.  This "JP Morgan Guide to the Markets" can be accessed here. The following are some of the highlights presented in this guide: all the data are at the end of 31Dec2021:


-------------------

Read more: 

ETF Compare - Nifty BeES and Junior BeES

BSE 500 vs S&P 500 Indices 

Who is Eating my Gold ETF Return?

Foreign Investors Waning Interest in Indian Stocks

Indian Equity ETF Risks and Returns

Modi Rally, Recency Bias and Stock Market Returns

Indian Mutual Funds and The Art of Ripping Off Investors  

Do Paint Stocks and Crude Oil Tango?

Weblinks and Investing

-------------------

- - -

Disclosure:  I've vested interested in Indian stocks and other investments. It's safe to assume I've interest in the financial instruments / products discussed, if any.

Disclaimer: The analysis and opinion provided here are only for information purposes and should not be construed as investment advice. Investors should consult their own financial advisers before making any investments. The author is a CFA Charterholder with a vested interest in financial markets. 

CFA Charter credentials  - CFA Member Profile

CFA Badge


He blogs at:

https://ramakrishnavadlamudi.blogspot.com/

https://www.scribd.com/vrk100

Twitter @vrk100

Sunday 30 January 2022

ETF Compare - Nifty BeES and Junior BeES - vrk100 - 30Jan2022

ETF Compare - Nifty BeES and Junior BeES 


(Please check related blog dated 15Feb2023 on Nifty Next 50)


Nippon India ETF Nifty BeES and Nippon India ETF Junior BeES are one of the oldest exchange-traded funds in India. They started trading on stock exchanges in 2001 and 2003 respectively.

The underlying indices of Nifty BeES and Junior BeES are Nifty 50 index and Nifty Next 50 index respectively. As they have the longest track record in India, let us explore how they have performed over the years.

Annual Returns

Table 1 and 2  delineate how the two ETFs have performed on an annual basis from 2004 to 2021. They also portray the asset size and expense ratios of the ETFs as at the end of the respective calendar years.

You can see that Nifty BeES' assets under management (AUM) grew from merely Rs 23 crore at the end of 2004 to Rs 5,677 crore by end-2021. With Junior BeES, AUM increased from a meagre Rs 9 crore to Rs 2,294 crore in the same period.

Of late, ETFs have been gaining traction with Indian stocks attracting a wider range of investor community. 

Expense ratios of these ETFs are competitive with competition growing among the mutual fund industry with several fund houses launching various kinds of ETFs based not only on the broader indices, but also based on several other narrow (dubbed as smart) indices.

As on 31Dec2021, the expense ratios of Nifty BeES and Junior BeES are 0.05 per cent and 0.17 per cent respectively--they are competitive; but could undergo changes depending on the changes in asset size and other market factors.

Readers can see that in some years one ETF does well and in others another ETF performs better.

On the NSE stock exchange, these two ETFs have decent volumes. Volumes on BSE are considerably lower.

(please click on the images to view better)


-------------------

Read more: 

BSE 500 vs S&P 500 Indices 

Who is Eating my Gold ETF Return?

Foreign Investors Waning Interest in Indian Stocks

Indian Equity ETF Risks and Returns

Modi Rally, Recency Bias and Stock Market Returns

Indian Mutual Funds and The Art of Ripping Off Investors  

Do Paint Stocks and Crude Oil Tango?

Weblinks and Investing

-------------------


Trailing Returns

Table 3 depicts trailing returns of Nifty BeES ETF and Junior BeES ETF from 1-year to 10-year period. It also provides details of risk measures, namely, Sharpe ratio and tracking error.

Sharpe ratio is a measure that describes the return earned per unit of risk taken to earn the returns. The higher the ratio, the better for the investor. Nifty BeES has got a higher Sharpe ratio.

Tracking error shows how closely the ETF is able to track the performance of the underlying index. A lower tracking error indicates that the ETF is able to match the performance of the underlying index with a smaller deviation.

From an investor's viewpoint, the lower the tracking error, the more desirable the ETF. At 0.11 per cent, Nifty BeES has lower error versus Junior BeES' 0.25 per cent.

If you look at table 3, you could see the difference  between the 10-year return of Nifty BeES and its underlying index is just 0.20 percentage points (or 20 basis points). Whereas, the difference is higher at 0.80 percentage points between the Junior BeES and its underlying index. This greater difference results in the latter having a higher tracking error.

The return profile presents a mixed picture. In some years, Nifty BeES does well and in others, Junior BeES does well. For example, on a 10-year trailing basis, Junior BeES has provided superior returns; but Nifty BeES did better on a 5-year trailing basis.


Overall Score

Table 4 provides how the two ETFs stack up on parameters outlined against them. 


To sum up, the reader can decide for herself how to choose between these two ETFs based on the analysis provided above. Interested readers may access my other articles presented on this blog to get a better grip on mutual funds and other financial instruments (in the past decade, this blogger has contributed almost 300 articles on financial markets). 

Finally, it is better to read the important documents available with the fund house before considering the ETFs for investment. 

This is not a recommendation for either of the ETF. This is just an attempt to bring the risks and returns inherent in them so that the reader can decide for herself. Happy investing!

- - - 


Additional data: As per blog post dated 24Jan2022 - NSE Indices Comparison>


Nifty Indices trailing returns as on 31Dec2021 >


References:

Nifty 50 Index Evolution Over a Decade

NSE Indices Comparison   - compare Nifty 50, Nifty Next 50, Nifty 100 and Nifty 500

Mutual fund asset class returns 

India Equity ETF Risks and Returns 31Dec2021  


BSE 500 versus S&P 500 Indices 31Dec2021 


Nippon India MF factsheet for Jan2022 (data end-31Dec2021)


Value Research compare Junior BeES and Nifty BeES


Disclosure:  I've vested interested in Indian stocks and other investments. It's safe to assume I've interest in the financial instruments / products discussed, if any.

Disclaimer: The analysis and opinion provided here are only for information purposes and should not be construed as investment advice. Investors should consult their own financial advisers before making any investments. The author is a CFA Charterholder with a vested interest in financial markets. 

CFA Charter credentials  - CFA Member Profile

CFA Badge


He blogs at:

https://ramakrishnavadlamudi.blogspot.com/

https://www.scribd.com/vrk100

Twitter @vrk100

Friday 28 January 2022

Nifty 50 Index Evolution Over a Decade - vrk100 - 28Jan2022

Nifty 50 Index Evolution Over a Decade


 (A new blog post is available here with an update of the information as of 31Mar2022)

Stock indices evolve. In the process, they change their complexion. This article explores the movement of Nifty 50 Index in the past decade--how the stock and sector leadership changed over the years.

Data pertaining to top ten stocks and sectors are presented for three years, namely, 2011, 2016 and 2021. All data are as at the end of 31st of December of the particular year. 


-------------------

Related Blog: 

NSE Indices Comparison   - compare Nifty 50, Nifty Next 50, Nifty 100 and Nifty 500

------------------- 


The weights of the stocks and sectors are index weights (based on free float method) in Nifty 50. It may be recalled that NSE Limited shifted Nifty 50 computation from full market capitalisation to free float market capitalisation method effective 26Jun2009.

Incidentally, BSE Limited was first off the block to introduce indices based on free float market capitalisation methodology. Sensex shifted to free float mechanism effective 01Sep2003. Most of the global equity indices follow free float methodology.

Table 1 gives details of top ten stocks in Dec2011, Dec2016 and Dec2021 > (please click on the image to view better)

In 2011, Infosys, Reliance Industries and ITC Ltd used to dominate Nifty 50 Index (formerly S&P CNX Nifty index). In the next five years, the leadership changed to HDFC Bank, ITC and Infosys--with HDFC Bank climbing to the top by 2016.

Even though Infosys continued to be among the top three in 2011 and 2016, its weight in Nifty 50 index was down from 9.4 per cent in 2011 to 6.7 per cent in 2016.

Between 2011 and 2016, Hindustan Unilever (formerly Hindustan Lever Ltd) and State Bank of India were dethroned from the top ten pedestal and their place among the top ten was occupied by Tata Motors and Kotak Mahindra Bank. 

Hindustan Unilever regained its position among the top ten somewhere between 2016 and 2021. Reliance Industries climbed spectacularly between 2016 and 2021 and rules the roost in Nifty 50 now.

Between 2016 and 2021, HDFC Bank gained weight from 8.1 per cent to 8.5 per cent, but lost its bellwether position. In recent quarters, ICICI Bank is snapping at the heels of HDFC Bank. It remains to be seen whether ICICI Bank will be able to surpass HDFC Bank in the future.

And the biggest disappointment in the past five years is ITC, which lost its number two rank and is now at the bottom of the top ten as of December 2021. 

-------------------

Read more: 

BSE 500 vs S&P 500 Indices 

Who is Eating my Gold ETF Return?

Foreign Investors Waning Interest in Indian Stocks

Indian Equity ETF Risks and Returns

Modi Rally, Recency Bias and Stock Market Returns

Indian Mutual Funds and The Art of Ripping Off Investors  

Do Paint Stocks and Crude Oil Tango?

Weblinks and Investing

-------------------

From the above table, readers can observe how stocks changed their ranking as well as their weight in the index over the years between 2011 and 2021. 

It can be reasonably guessed that in the next ten years too, Nifty 50 index will change its complexion. It is expected that some new stocks, belonging to nascent sectors of the economy, will dominate the index in the future.


Table 2 gives details of top ten sectors in Dec2011, Dec2016 and Dec2021 > (please click on the image to view better)    


Financial services and information technology have remained number one and two respectively in all these years between 2011 and 2021. Between 2016 and 2021, Oil & Gas sector has regained its top three position with the Reliance Industries stock making smart gains after its entry (one could as well say re-entry) into the telecom services sector in 2016.

Though Pharma sector retained its sixth position in 2021, its share in the index fell from 6.3 per cent in 2016 to 3.4 per cent in 2021. Metals sector climbed to seventh position with awesome gains in 2021.

The top three sectors in the index have increased their dominance tremendously between 2011 and 2021. Table 2 reveals interesting pattern between 2011 and 2021.

Financial services, information technology, Oil & Gas and Consumer goods have been dominating (with a combined weight of 78 per cent in 2021) the Nifty 50 index.


Big is Getting Bigger

This is the biggest development in the past five years. Big corporates are getting bigger. The most surprising thing is Corporate India has attained tremendous pricing power (the ability of a company to raise prices of goods and services without any significant impact on the demand) despite the negative impact of the COVID-19 Pandemic on demand in the past two years.

Of course, this is good for a small section who have direct and indirect exposure to equity markets. 

If you look at how the stock and sector concentration moved between 2016 and 2021, you will realise that big companies have been getting bigger and their market values have been growing.

For example, top 5 and 10 stocks used to carry a total weight of 34.1 and 52.8 per cent respectively in 2016. But the numbers have grown substantially by 2021 with the top 5 and 10 stocks accounting for 41.5 and 58.4 per cent respectively (table 1 above).

The same story continues with concentration risk reaching higher levels sector-wise also. The top 3 and 5 sectors have increased their weights in Nifty 50 index from 57.5 and 76.9 per cent respectively to 67.0 and 82.7 per cent respectively (table 2 above).

Nifty 50 Index is increasingly getting concentrated with top 10 stocks and top 5 sectors of the economy. Of course, this is only from the listed universe. Unfortunately, some big developments in the Indian economy--especially in the past five to six years--have negatively impacted small and medium businesses. 

These developments have provided an opportunity for Corporate India to increase their influence in the economy. Ideally, all businesses, big and small, should have equal opportunity to grow in their respective fields. This seems to be not the case now.


Investment Implications

Sorry for the digression! Coming back to the main point, the increasing concentration risk has investment implications for passive and active investors. 

Only a few stocks and sectors dominating the main indices is a positive for passive investors (those who invest in index and exchange trade funds / ETFs). And it is becoming increasingly difficult for active fund managers to beat the indices with high concentration.

The data provide a thumbs-down to the time-tested principles of diversification in portfolio management. This is a challenge for investors and money managers going forward.

As such, in my opinion, it may be advisable to consider taking some exposure, depending one's risk appetite and financial position, to passive investment vehicles. Let us wait and watch what the future holds for investors who go by the credo of diversified portfolios. 


 - - -


 Raw data > Taurus Nifty 50 Index fund; SEBI Bulletin Jan2017 and Nifty 50 factsheet >


References:

NSE Nifty Indices monthly factsheets 

NSE Indices Comparison   - compare Nifty 50, Nifty Next 50, Nifty 100 and Nifty 500

Mutual fund asset class returns 

India Equity ETF Risks and Returns 31Dec2021 


BSE 500 versus S&P 500 Indices 31Dec2021


Disclosure:  I've vested interested in Indian stocks and other investments. It's safe to assume I've interest in the financial instruments / products discussed, if any.

Disclaimer: The analysis and opinion provided here are only for information purposes and should not be construed as investment advice. Investors should consult their own financial advisers before making any investments. The author is a CFA Charterholder with a vested interest in financial markets. 

CFA Charter credentials  - CFA Member Profile

CFA Badge


He blogs at:

https://ramakrishnavadlamudi.blogspot.com/

https://www.scribd.com/vrk100

Twitter @vrk100


Wednesday 26 January 2022

BSE 500 versus S&P 500 Indices 31Dec2021 - vrk100 - 26Jan2022

BSE 500 versus S&P 500 Indices 31Dec2021


(update 11Jan2023 with info as of 31Dec2022 is available here)


Indian investors have of late been attracted by global stocks, especially those in the US. Some smart investors go through the route of direct investments. Others have chosen the path of mutual funds.

The advantage of mutual funds is one can start small and grow their investment corpus over a period of years, without the hassle of worrying about the performance of individual stocks. 

The Indian investor's interest in global mutual fund schemes can be gauged from the increase in asset size of the funds with exposure to international stocks (global stocks other than Indian ones).

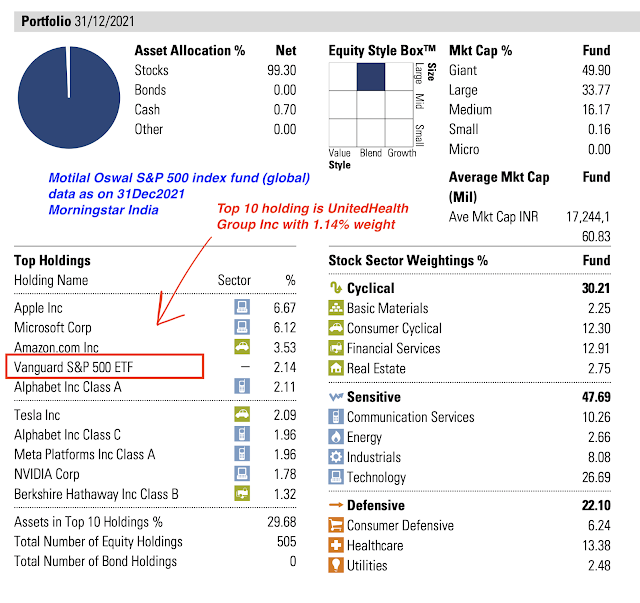
For example, Motilal Oswal S&P 500 Index fund has an asset size of more than Rs 2,700 crore, even though it was launched less than two years back. Another fund, ICICI Prudential US Bluechip Equity Fund has an asset size of Rs 2,000 crore.

There are other funds with exposure to non-US stocks in the Asian nations, such as, China, Taiwan and Japan.


-------------------

Read more: 

Who is Eating my Gold ETF Return?

NSE Indices Comparison 

Foreign Investors Waning Interest in Indian Stocks 

RBI Bought 200 tonnes of Gold

7 Reasons why Gold Monetization Scheme will be a failure

FPI Flows into Indian Stock Market

Indian Equity ETF Risks and Returns

Modi Rally, Recency Bias and Stock Market Returns

Indian Mutual Funds and The Art of Ripping Off Investors  

Do Paint Stocks and Crude Oil Tango?

Weblinks and Investing

-------------------


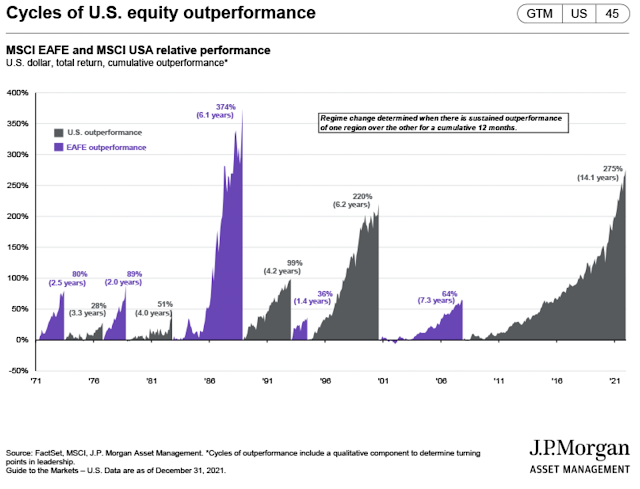
Though the structure and composition of the Indian and US stocks markets are different, there is strong correlation of returns between the US stocks, as represented by the S&P 500 index and the Indian stocks represented by BSE 500 index. Financial markets across the globe are closely connected.

A brief analysis is made to examine the differences and similarities between these two indices, namely, BSE 500 and S&P 500. All the data are as of 31st of December 2021.

Fundamentals: 

Table 1: Risks, Returns and Valuation parameters >  


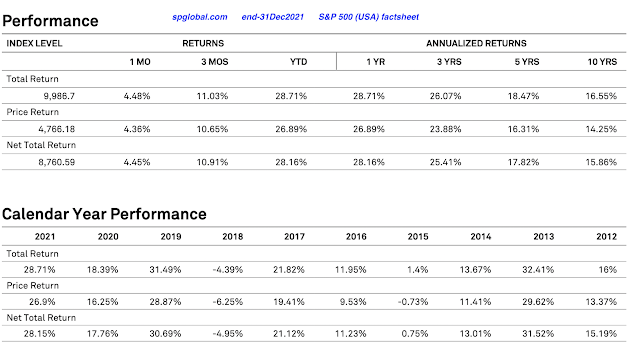
On a one-year and 10-year basis, BSE 500 index has outperformed the S&P 500 index. But on a 3-year and 5-year basis, S&P 500 has attained superior returns. Here, total returns including dividends are considered.

When you take risk measure standard deviation, S&P 500 index has done better than BSE 500 for the three-, five- and 10-year periods. The lower the standard deviation, the better the index from a risk mitigation perspective.

As the S&P 500 has lower standard deviation, Sharpe ratio for S&P 500 index is superior for all the three time periods shown the exhibit above. Sharpe ratio is a measure that indicates an investment return adjusted for risk. 

Investments with higher Sharpe ratios are considered as providing superior risk-adjusted returns.


Top 10 Stocks: 

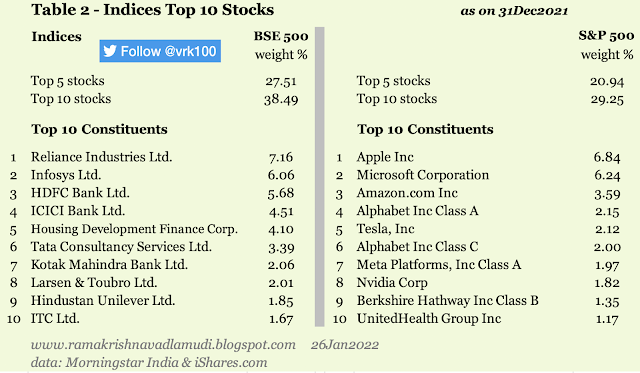
Table 2: Top 10 stocks and Concentration Risk >

As Table 2 shows, concentration risk for BSE 500 is considerably higher as compared to S&P 500. Top 5 and 10 stocks have a total weighting of 27.5 per cent and 38.5 per cent respectively in BSE 500; whereas the values are just 20.9 and 29.3 per cent for S&P 500 index.

The top five components in the S&P 500 are from the so-called Big-Tech sector in the US, namely, Apple, Microsoft, Amazon, Google and Tesla. Whereas, the top five stocks in BSE 500 belong to Energy, Software and financial services sectors--they are Reliance Industries, Infosys, HDFC Bank, ICICI Bank and HDFC Ltd.

BSE 500 has 501 holdings, whereas S&P 500 has 505 holdings. 


Top 10 Sectors: 

Table 3: Top 5 Sectors and Concentration Risk >


The third exhibit gives a different picture as regards the concentration risk. Based on the top 5 and 10 stocks, we've concluded that concentration risk is hither for BSE 500 (Table 2 above). But  concentration risk appears to be higher for S&P 500 when you look at the weightings of top sectors in the index.

Top 3 and 5 sectors have total weighting of 55 and 76 per cent respectively in S&P 500. But in BSE 500, their weights are lower at 54 and 72 per cent respectively.

Only Financial Services is present among top three sectors of the two indices. Technology sector stocks dominate S&P 500, whereas BSE 500 is dominated by Financial Services stocks,  like, banks, finance and insurance companies.

Healthcare sector's exposure in S&P 500 is more than double that of it in BSE 500. BSE 500 has more than 10 per cent exposure to materials sector, but S&P 500's exposure is just 2.60 per cent. Energy has higher weighting in BSE 500. 

Overall, BSE 500 tends to be dominated by old economy stocks, whereas S&P 500 is dominated by Big-Tech, new-age and innovative segments of the economy. 

Of course, it is expected that Indian indices too will increasingly lean toward new-age and innovation-led companies. It takes a lot of time and effort on the part of Indian entrepreneurs--with sensible rule of law, better business practices and solid infrastructure.


Conclusion

Investors tend to suffer from home bias, the tendency of investors to restrict their stock universe to domestic equities avoiding exposure to stocks outside their nation.

From a diversification and risk management perspective, it is generally better for domestic investors to have some exposure to international stocks and correct their home bias. 

Mutual fund are excellent vehicles for early and novice investors. Increasing awareness of the benefits of international diversification has allowed Indian investors (especially those exposed to US stocks) to benefit from the non-domestic exposure.

Not many can stomach the gut-wrenching volatility inherent in the financial markets. We need to train our minds towards long term orientation, compounding benefits and unwavering attitude.

This is a not a recommendation. This is a little attempt to bring the characteristics and nuances involved in the construction and composition of the indices to my readers. This is just for educational purpose, some kind of an education for the author himself!

- - -


 P.S. 1: Expense ratios of ICICI Prudential BSE 500 ETF  and that of Motilal Oswal Nifty 500 Index fund are 0.29% and 0.39% respectively. Whereas iShares Core S&P 500 ETF and SPDR S&P 500 ETF Trust have expense ratios of 0.03 and 0.09 per cent respectively.

P.S. 2: I've looked at the top 10 stocks and sectors of the BSE 500 and Nifty 500 indices. Both are strikingly similar in terms of stock / sector concentration, large-, mid- and small-cap weights and other broader parameters. There is practically no difference between the composition of BSE 500 and Nifty 500 indices.


References:

My Blog 15Jan2022 - India Equity ETF Risks and Returns - this blog contains 55 images / screenshots with lots of data for several years

S&P Dow Jones Indices - S&P 500 and other US indices monthly factsheets, index methodology and others 

S&P Dow Jones Indices - BSE 500 and other BSE indices monthly factsheets, index methodology and others 

BSE 500 index monthly factsheet - S&P Global

S&P 500 index monthly factsheet - S&P Global

ICICI Pru BSE 500 ETF - Morningstar India

iShares Core S&P 500 ETF - monthly factsheet


Nifty 500, BSE 500 and S&P 500 compare - M

Nifty 500, BSE 500 and S&P 500 compare - V

Tweet thread 07Jun2021 -  compare funds / ETFs - BSE 500 ETF, concentration risk, etc.

Three Tweets 20May2021 - one, two and three -  data 30Apr2021  

Tweet 20May2021 - Compare funds / ETFs based on broad-based indices

Tweet thread 05Jan2021 -  Nifty 50, Nifty 100, Nifty 500 and Nifty Next 50 indices 31Dec2020 data >

Tweet 08Sep2020 - data 31Aug2020 - Compare funds / ETFs based on broad-based indices

Tweet 01Sep2019 - compare funds / ETFs based on Broad indices, like, Nifty 50, Nifty Next 50 (Junior Nifty), etc.

Tweet 02Aug2019Compare funds / ETFs based on broad-based indices

Tweet thread 15Oct2018 - Compare funds / ETFs based on broad-based indices       

My Tweet 17Apr2021 - BSE 500 vs S&P 500

My Tweet 17Apr2021 -  BSE 500 vs S&P 500 concentration risk

My Tweet 30Jun2019 - Dual class shares (US) - Harvard paper

My Tweet 30Jun2019 - Class A shares of Google (Alphabet)

My Tweet 31Aug2018 - GICS sectors -  Global Industry Classification Sector


Raw data from Morningstar India, S&P Global (S&P Dow Jones Indices) and iShares (all the images have data as of 31Dec2021) >


Disclosure:  I've vested interested in Indian stocks and other investments. It's safe to assume I've interest in the financial instruments / products discussed, if any.

Disclaimer: The analysis and opinion provided here are only for information purposes and should not be construed as investment advice. Investors should consult their own financial advisers before making any investments. The author is a CFA Charterholder with a vested interest in financial markets. 

CFA Charter credentials  - CFA Member Profile

CFA Badge


He blogs at:

https://ramakrishnavadlamudi.blogspot.com/

https://www.scribd.com/vrk100

Twitter @vrk100