Sunday 19 June 2022

Slowest Growth in India's Real Per Capita Income - vrk100 - 19Jun2022

Slowest Growth in India's Real Per Capita Income


(Updates 05Mar2023, 05Mar2023, 28Feb2023, 04Dec2022, Update 30Nov2022 with Q2 GDP data for FY 2022-23; and Update 16Sep2022 with Q1 GDP data for FY 2022-23 are available at the end of this article) 


Governments are in the habit of making tall claims about economic progress and pull wool over citizens’ eyes. Day in and day out, we’re bombarded with useless data about the progress India has been making on all fronts–all part of a disinformation campaign. The governments will deflect our attention by not throwing light on what is needed for our progress, but they selectively highlight what they want the masses to know. 


Ultimately, all actions taken and bets not taken are to reflect in per capita income of the population--but actually the "accomplishments" of the governments are not reflecting in personal incomes. One of the biggest failures of the PM Modi government in the past eight years is lack of job creation (others include, disastrous demonetisation or note ban of November 2016, sloppy rollout of goods and services tax or GST, draconian Corona Virus lockdowns and so on).


India's real per capita GDP* fell by 7.6 per cent in 2020-21 to Rs 100,032. Mind you, this includes the incomes of the Ambanis, Adanis, Tatas, Birlas and the like. If you exclude them, I'm sure ours has plunged by more than 25 per cent! 


[* gross domestic product at constant (2011-12) prices adjusted for inflation]


During 2021-22, the real per capita income rose by 7.6 per cent to Rs 107,670. Interestingly, the per capita income during 2019-20 was Rs 108,247. So, in the past two years, the per capita income fell by 0.27 per cent which is unprecedented in India’s history. 


Of course, Indian government has got a good excuse in the form of COVID-19 Pandemic to justify the fall in personal incomes. What is not highlighted is the fact that the fall in personal incomes is mainly self-inflicted, that is attributable to the draconian lockdowns imposed by the PM Modi government in March-June 2020. 


Everyday, we’re told tax collections in India are at record highs. The gullible never understand why tax collections are high when their own personal incomes are down in the dumps. It’ll take some time for the masses to figure out tax collections are high due to the simple fact that tax rates are high; tax extortion is high; every payment and receipt are subject to tax deduction at source (TDS) and / or tax collected at source (TCS); and high indirect taxes have been hurting the vulnerable classes more.


India's per capita income is low and prospects for income mobility are dim. More students have been going abroad for studies as they are unable to find good opportunities at home. Most jobs are created in the information technology sector, especially for the educated people–which is also good indirectly for those in the lower strata of society.


(story continue below)


--------------

Related:


Why is India Falling Behind Bangladesh?


India 2nd quarter GDP FY 2021-22

 --------------


The vulnerable classes are forced to depend on jobs created, not so well-paid, by the e-commerce and other digital sectors of the economy.


Adam Smith


"The wealth of a nation must be measured by its per capita income. Only a commercial society, in which every individual acted in their own self-interest but was driven by competition, would improve everybody’s life for the better," thus said Scottish philosopher and economist Adam Smith more than 250 years back.


It's a big disappointment most of the young are unable to enjoy upward mobility in their careers. Rather, they are staring at the prospect of downward mobility. 


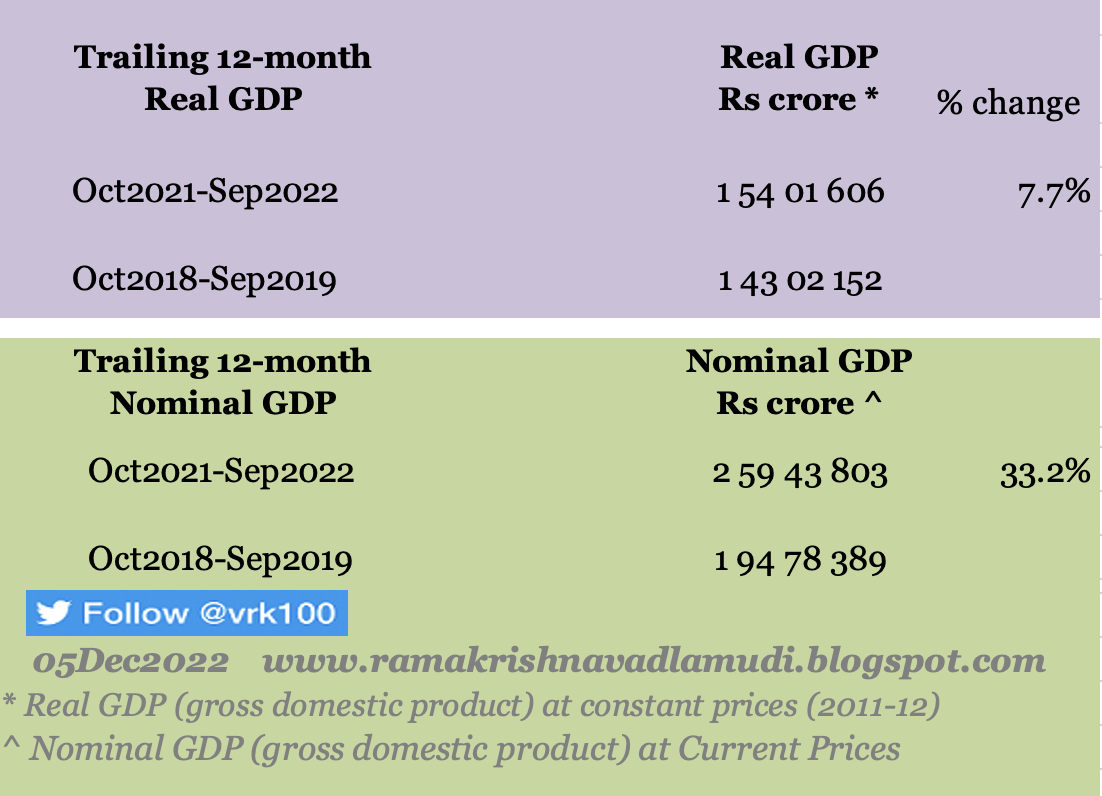
The following tables highlight the GDP data of several years:


Table 1: India's Real per capita GDP Annualised Growth Rate % under PM Modi government:


This is a fun diagram to 'extol' India's accomplishments >


e.g. i) annualised real per capita GDP growth rate for the past eight years (between 2013-14 and 2021-22) is 4.05%


ii)  annualised real per capita GDP growth rate for the past five years (between 2013-14 and 2021-22) is 2.59%


iii) annualised real per capita GDP growth rate for the past two years (between 2019-20 and 2021-22) is negative 0.27


Table 2: India's per capita GDP -- at current prices and constant prices (base year 2011-12) > 


Table 3:
India's Real GDP Annualised Growth Rate % under PM Modi government:


This is a fun diagram to 'extol' India's accomplishments >


e.g. i) annualised real GDP growth rate for the past seven years (between 2014-15 and 2021-22) is 4.92%


ii)  annualised real per capita GDP growth rate for the past four years (between 2017-18 and 2021-22) is 2.90%


iii) annualised real per capita GDP growth rate for the past two years (between 2019-20 and 2021-22) is just 0.75%

Table 4: India real GDP growth rate (yearly) at constant prices (base year 2011-12) >

Table 5: India real GDP growth rate (quarterly) at constant prices (base year 2011-12) >

Table 6: India GDP growth rates (yearly) at current prices >

Table 7: India GDP growth rates (quarterly) at current prices >

References:
 
Downward mobility of middle classes
 
Mospi press note 31May2022

Tweet 27Feb2021 on India per capita GDP

Tweet 11Jun2019 Lack of Mobility

Lack of mobility undermines aspirations - World Bank

Economic mobility stalled - World Bank

Massive study on economic mobility

- - - 
 
P.S.: Update on 05Mar2023 with real and nominal Per Capita GDP data from 2011-12 to 2022-23 (2022-23 data are as per advance estimates released on 28Feb2023)  >
 
Real and nominal per capita data numbers are much worse than overall GDP data due to steady population growth rate in India. 

Real per capita GDP grew (CAGR) by just 2.1 percent in the past three years (b/w 2022-23 and 2019-20). And the 9-year CAGR for real per capita GDP is just 4.4 percent. 
 
Compare this lacklustre per capita growth of 2.1 percent with price rise in LPG cylinder (14.2 KG used for domestic use). In the past three years, the cost of cylinder used by domestic households rose by an annualised growth rate of 13.2 percent (from around Rs 800 in 2020 to Rs 1,155 now). 

This is just one item I compared, readers can compare prices of other essential items -- and can come to their own conclusions. 

For 2022-23, real per capita GDP (adjusted for inflation) is Rs 115,490 and nominal per capita GDP is Rs 196,716 -- as per Indian government's latest estimates.


P.S.: Update on 05Mar2023 with real and nominal GDP data from 2011-12 to 2022-23 (2022-23 data are as per advance estimates released on 28Feb2023) > India real GDP growth rates have been anaemic for the past nine years, despite tall talk. 
 
Why do I say anaemic growth rates? You check the data of compounded annualised growth rates (CAGR) from now (FY 2022-23) to past three to 11 years. 
 
For example, the past three years CAGR of real GDP between FY 2022-23 & 2019-20 is just 3.2 percent (of course, it was due to slump in GDP caused by draconian COVID-19 lockdowns in 2020-21). 
 
Or, you take 5-year CAGR (b/w 2022-23 & 2017-18) of real GDP, which is just 4.0 percent. Even 9-year CAGR (b/w 2022-23 & 2014-15) is just 5.6 percent (which is a poor reflection on the PM Modi government which has been in power continuously since 2013-14).


P.S.: Update on 28Feb2023 with Q3 GDP data for FY 2022-23 > Nominal GDP and Real GDP growth rates > (this MOSPI press note is important because it contains more than 10 years of data for real as well as nominal GDP numbers)

Drastic slowdown in India's real GDP growth rate: in first half of FY 2022-23, India's real GDP grew by 9.57 percent; and in second half of FY 2022-23, real GDP is estimated to show a tepid growth of just 4.76 percent.
 
India's real GDP (at constant prices 2011-12) for FY 2022-23 is expected to grow by 7 percent to Rs 159.71 lakh crore compared to FY 2021-22; and the third quarter GDP grew by 5.1 percent compared to 3rd quarter of previous year.

India's nominal GDP for FY 2022-23 is expected to grow by 15.9 percent vs previous financial year; and the third quarter GDP at current prices grew by 9.9 percent. Table 1 and 2 >


P.S.: Update on 05Dec2022 > GDP deflator > difference between real and nominal GDP numbers between Jul-Sep2019 and Jul-Sep2022 quarters > it turns out cumulative inflation as measured by the GDP deflator is a whopping 26.7 percent (real GDP grew by 7.6% vs nominal GDP growth of 34.3% -- see below image) >

Tweet thread 30Oct2022 on CPI inflation>
 
 
Instead of one quarter numbers, I've compared the real and nominal GDP numbers for the trailing 12-month figures as at the end of Sep2019 and Sep2022 > it turns out cumulative inflation as measured by the GDP deflator is 25.5 percent (real GDP grew by 7.7% vs nominal GDP growth of 33.2% -- see below image), only slight difference between the quarterly and 12-month numbers > 


P.S.: Update on 30Nov2022 with Q2 GDP data for FY 2022-23 > Nominal GDP and Real GDP growth rates >


P.S.: Update on 16Sep2022 with Q1 GDP data for FY 2022-23 > 


-------------------

Read more:  

Why is India Falling Behind Bangladesh?

How Rates and Ratios are Moving

Slowing Foreign Direct Investment to India

JP Morgan Guide to Markets

Rant on Tata Steel Ltd

A Quick Glance at UPL Limited 

What is Cooking Behind LT Foods' Share Price Rise?

A Rundown on Prince Pipes & Fittings

Primer on Credit Rating Scales

When Will Foreign Investors Stop Selling Indian Stocks?

Indian Mutual Funds and The Art of Ripping Off Investors  

Do Paint Stocks and Crude Oil Tango?

Weblinks and Investing

-------------------

Disclosure:  I've vested interested in Indian stocks and other investments. It's safe to assume I've interest in the financial instruments / products discussed, if any.

Disclaimer: The analysis and opinion provided here are only for information purposes and should not be construed as investment advice. Investors should consult their own financial advisers before making any investments. The author is a CFA Charterholder with a vested interest in financial markets. 

CFA Charter credentials  - CFA Member Profile

CFA Badge


He blogs at:

https://ramakrishnavadlamudi.blogspot.com/

https://www.scribd.com/vrk100

Twitter @vrk100

Why is India Falling Behind Bangladesh? - vrk100 - 19Jun2022

Why is India Falling Behind Bangladesh?


In October 2020, there was widespread resentment in India when it was reported that India's per capita GDP (gross domestic product), according to estimates from International Monetary Fund (IMF), had fallen below that of Bangladesh. The media and pundits at that time were selective in their outrage upon this news item. At that time, I pointed out media's bluff by giving full details of the IMF data. 
 
Now, IMF has published new and revised data in its World Economic Outlook of April 2022. According to these latest estimates, India was still behind Bangladesh on per capita income basis in 2020. India's per capita GDP (at current prices) in 2020 was USD 1,935; while Bangladesh was ahead with USD 1,962.

What is not reported in the media now is: India had caught up with Bangladesh in 2021 and 2022 and in fact is ahead of Bangladesh on per capita GDP basis, according to the latest IMF data. 

Table 1: Bangladesh versus India - per capital GDP: 
 
All the data presented here are in US dollars; and PPP data are in international dollars
 
(please click on the table for a better view)


As can be seen from the above table, India's per capita GDP is USD 2,515 in 2022 while Bangladesh is now behind India at USD 2,362. These numbers are at current prices expressed in US dollars for comparison purposes.

Bangladesh's per capita GDP is just USD 6,633 in 2022 on purchasing power parity (PPP) basis. But India is much ahead with per capita GDP (PPP) of USD 8,358. 
 
However, if you look at the long term data, growth rates of India's per capita GDP and GDP under PM Modi government are way behind those of Bangladesh under Sheikh Hasina government. 
 
Comparing Growth under PM Modi and PM Manmohan Singh:
 
As clearly shown in Table 1 above, India's GDP had grown at an annualised rate of 10.95 per cent between 2004 and 2014 under prime minister Manmohan Singh. Bangladesh had grown at a CAGR (compounded annualised growth rate) of 10.16 per cent during 2004-2014.
 
Let us compare Manmohan Singh's track record with that of PM Modi. Between 2014 and 2022 under PM Modi government,  India's annualised growth rate is just 7.12 per cent versus Manmohan Singh's 10.95 per cent. How is Bangladesh doing during 2014 and 2022. Between 2014 and 2022, Bangladesh has grown at a CAGR of 10.93 per cent versus India's dismal 7.12 per cent. 
 
Even on per capita GDP basis, India under PM Manmohan Singh has done much better than Bangladesh during 2004-2014; India under PM Modi has failed to surpass the annualised growth rates of Bangladesh during 2014-2022.
 
To sum up, India under PM Manmohan Singh was ahead of Bangladesh in 2004-2014 period on all parameters--GDP, GDP per capita and GDP per capita on purchasing power parity (PPP) basis (see Table 1). But India under PM Modi is way behind Bangladesh during 2014-2022.
 
India's growth rates under Singh are much better than those under PM Modi. All data points to this fact despite intense propaganda to the contrary by the current regime.
 
Why Is India Falling Behind Bangladesh?
 
It's clear the economic policies of the PM Modi government have failed to generate employment opportunities for the youth in India. There are many failures of his government: disastrous demonetisation or note ban of November 2016, sloppy rollout of goods and services tax or GST, draconian Corona Virus lockdowns of 2020, continued suffering of the unorganised, small and medium businesses, runway inflation for the past three years and so on. 
 
Bangladesh has attracted a lot of investments in manufacturing and its export economy has been growing by leaps and bounds. It has been thriving in exports of readymade garments, footwear and other sectors.  India has failed to match the progress of its small neighbour.
 
It is time PM Modi government focused its attention on job creation, instead of focusing 100-per-cent attention on winning elections. 
 
- - - 
 
References:

World Economic Outlook, Apr2022

Tweet 14Oct2020 India vs Bangladesh
 

-------------------

Read more:  

How Rates and Ratios are Moving

Slowing Foreign Direct Investment to India

JP Morgan Guide to Markets

Rant on Tata Steel Ltd

A Quick Glance at UPL Limited 

What is Cooking Behind LT Foods' Share Price Rise?

A Rundown on Prince Pipes & Fittings

Primer on Credit Rating Scales

When Will Foreign Investors Stop Selling Indian Stocks?

Indian Mutual Funds and The Art of Ripping Off Investors  

Do Paint Stocks and Crude Oil Tango?

Weblinks and Investing

-------------------

Disclosure:  I've vested interested in Indian stocks and other investments. It's safe to assume I've interest in the financial instruments / products discussed, if any.

Disclaimer: The analysis and opinion provided here are only for information purposes and should not be construed as investment advice. Investors should consult their own financial advisers before making any investments. The author is a CFA Charterholder with a vested interest in financial markets. 

CFA Charter credentials  - CFA Member Profile

CFA Badge


He blogs at:

https://ramakrishnavadlamudi.blogspot.com/

https://www.scribd.com/vrk100

Twitter @vrk100