Exit India Policy by Foreign Investors
(note: Updates with latest information charts as of 03Apr2024, 10Mar2024, 04Feb2024, 12Jan2024, 02Jan2024, 02Dec2023, 10Nov2023, 28Oct2023, 12Oct2023, 21Sep2023, 02Aug2023, 27Jul2023, 02May2023, 15Apr2023, 04Apr2023, 12Mar2023, 31Jan2023, 30Dec2022, 30Nov2022, 31Oct2022, 30Sep2022 and 31Aug2022 are available at the end of this blog)
There is no respite in foreign investors selling
Indian stocks. As stated in an earlier blog, the relentless selling has continued for the past three
quarters. During the period, foreign portfolio investors (FPIs) sold Indian
equities worth Rs 2.56 lakh crore or about USD 33 billion (see Table 3 and 4 below).
The FPI selling has put pressure on Indian rupee
with the rupee depreciating 5.9 percent versus the US dollar between end of
Dec2021 and end of Jun2022. Of course, rupee’s depreciation can be partly
explained by the fact that dollar itself has been gaining against major currencies,
with the dollar index (DXY) gaining 9.6 percent in the same period.
One could argue Indian rupee’s depreciation is
lower compared to major currencies across the globe. But India intervenes in
the market to control 'excess volatility' in exchange rate. As such, Indian rupee is not
completely market-driven.
While portfolio capital flows are seen as 'hot money' and volatility in such flows is considered normal, the more stable foreign direct investment (FDI) has slowed down last year.
It may be noted India’s central bank, Reserve Bank
of India, does not allow excess volatility in India’s exchange rate protecting
the interests of economic agents in India.
Between 2019 and 2021, RBI had tried every trick
in its armour to prevent rupee from depreciating against the dollar. But since
April 2022, RBI had temporarily stopped intervening in the foreign exchange
market and allowed the rupee to depreciate at a slightly faster pace.
One consequence of RBI's heavy intervention in defending the exchange rate is India’s foreign exchange reserves got depleted by
nearly USD 46 billion in the past six months. Of course, central banks bulk up on foreign exchange reserves to use them during uncertain times.
(article continues below)
---------------------
Read more on RBI Intervention
---------------------
Table 1: FPIs' Waning Interest in Indian Stocks >
(please click on the image for a better view)
As Table 1 above shows: FPIs assets under custody (AUC) as on 30Jun2022 are Rs 41.32 lakh crore (data from NSDL). Their share in Indian stocks has fallen from 19.9 percent in Mar2021 to 17 percent now.
Table 2: Data showing the intensity of FPIs' selling between Dec2021 and Jun2022 >
(please click on the image for a better view)
As Table 2 above shows equity AUC held by FPIs has declined by 14.9 percent in rupee terms to Rs 41.32 lakh crore between end-Dec2021 and end-Jun2022; even though total market cap of all BSE companies fell by just 8.4 percent during the period.
The share of equity assets held by FPIs has fallen from 18.3 percent in Dec2021 to 17 percent in Jun2022.
In
the past six to nine months, global uncertainties surrounding prolonged
inflationary expectations, commodity price rise, global supply chain
bottlenecks, rising interest rates, and fallout from Russian invasion of
Ukraine, have been at an elevated level.
It
is not clear when the clouds of uncertainty will disappear. The
heightened global volatility and uncertainty will continue to put
pressure on Indian rupee. As the US interest rates have been on an
upward trajectory, foreign investors seem to be moving money from emerging markets, including India, back to the US.
Investors
will therefore be kept on their toes in the next three to six months.
Caution may be required going forward even though financial market
volatility has come down in the past three weeks.
- - -
Additional data:
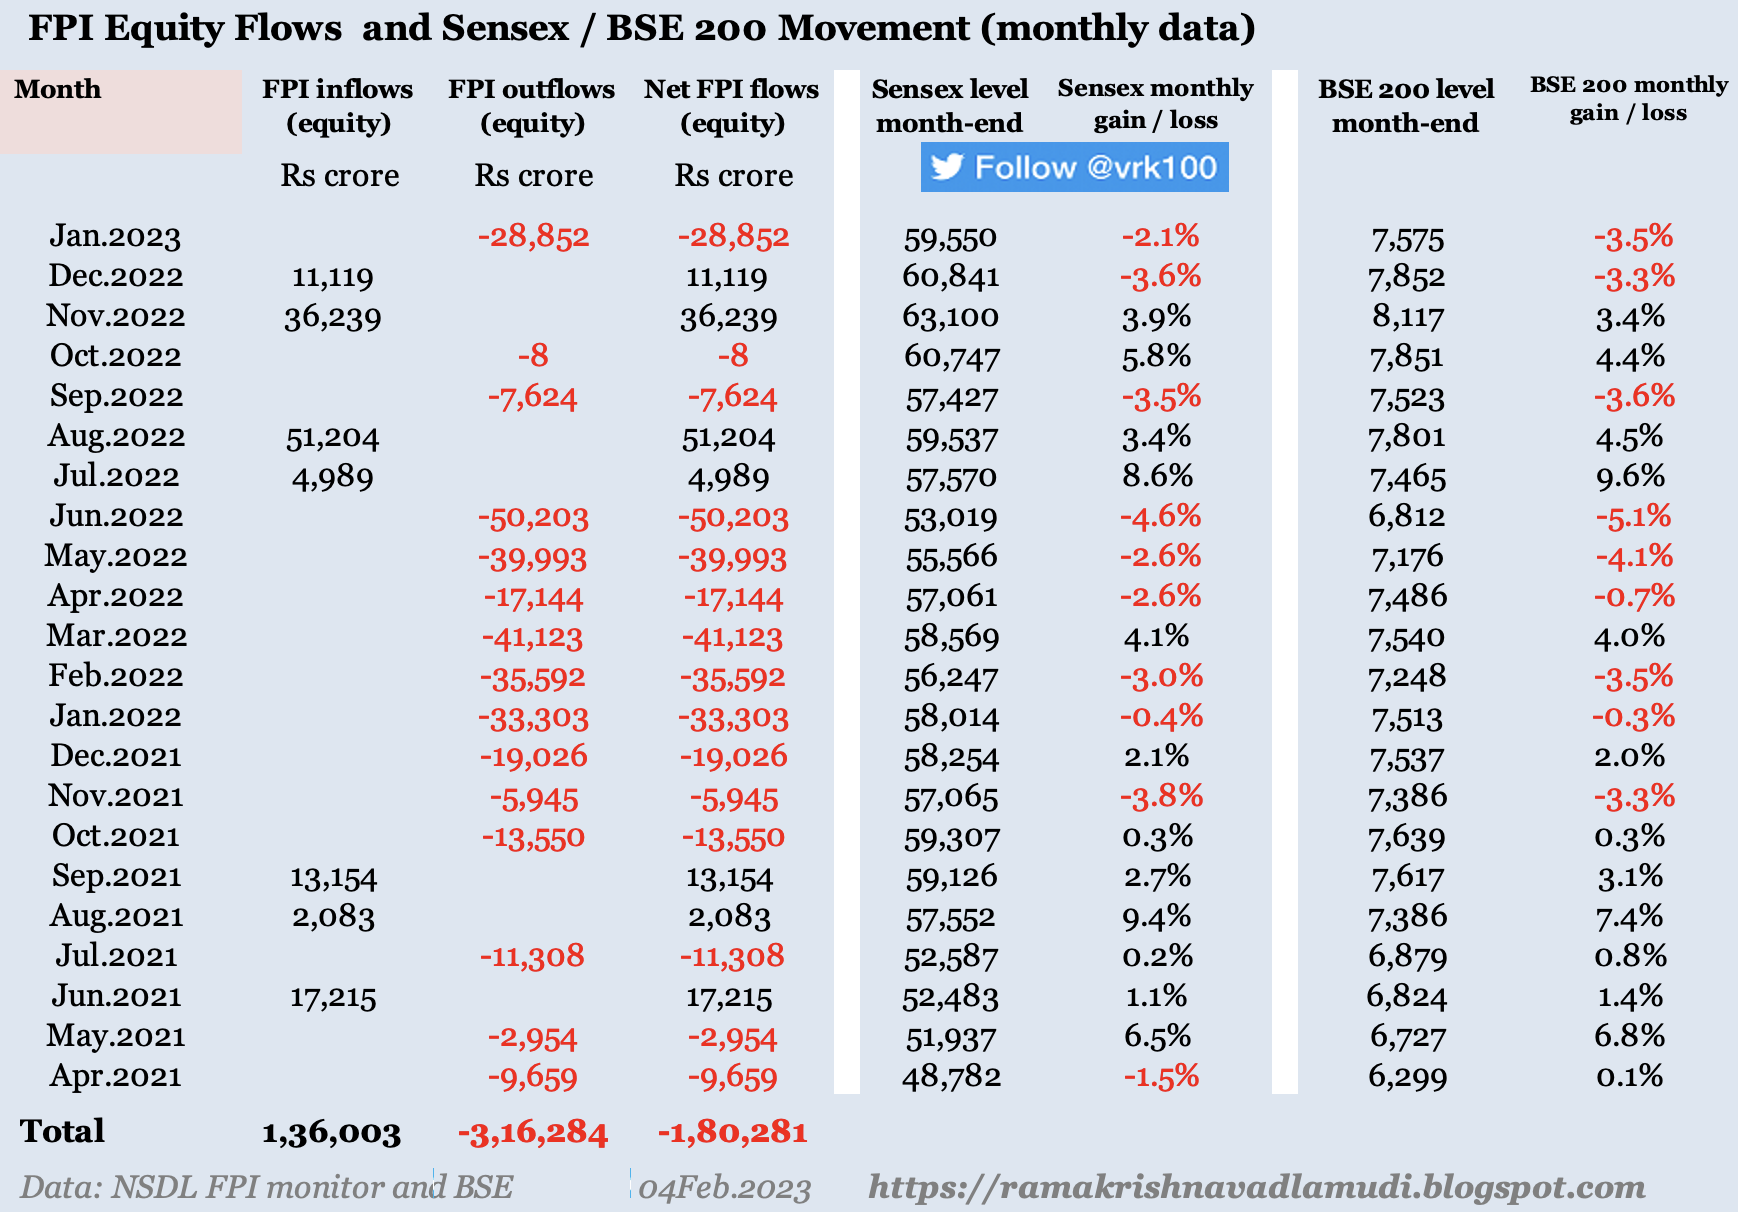
Table 3: Monthly FPI Flows to Indian Equities >
Table 4: Quarterly FPI Flows to Indian Equities >
- - -
P.S.: After writing the blog, the following updates are added with new information / images:
Update 03Apr2024: Data as on 31Mar2024: After two continuous years of negative flows, foreign investors came back strongly to Indian equity market with an inflow of Rs 2.08 lakh crore in FY 2023-24 (India's financial year is from April to March).
In fact, foreign investors are more attracted toward Indian bond market compared to Indian stock market. Their bond market flows in FY 2023-24 have been the highest in nine years.
Combined FPI flows of stock and bond market for FY 2023-24 are Rs 3.39 lakh crore, which are at record high in the past 14 years. Of course, these numbers are in rupees, not in US dollars. US dollar numbers may give a different picture. Moreover, these numbers are not corrected with other data -- say with India GDP.
Corrected for GDP data (FPI flows as a percentage of GDP) may give a different picture of the record FPI flows into Indian financial markets (combined stock and bond).
Below tables of monthly data and quarterly data of FPI flows too are provided >
Update 10Mar2024: Data as on 29Feb2024: After a month of negative flows, FPIs turned slightly positive in Feb2024 with inflows in equity market of Rs 1,539 crore.
Update 04Feb2024: Data as on 31Jan2024: After two consecutive months of positive flows, FPIs turned negative in Jan2024 and FPI outflows in equity market in the month were Rs 25,740 crore.
Update 12Jan2024: Data as on 31Dec2023: as
on 31Dec2023, equity assets under custody (AUC) by FPIs increased by 26.8
percent in the past one year (between Dec2022 and Dec2023) in rupee
terms to Rs 61.32 lakh crore.
Whereas in US dollar terms, equity AUC held by FPIs in the same period
increased by 25.9 percent to USD 736.95 billion as the Indian rupee
depreciated by 0.7 percent versus the US dollar.
FPI AUC in calendar year 2023 rose by 26.8 percent even though the BSE 200 index jumped by 22.8 percent -- this is the due to the additional boost from FPI equity inflows to the tune of Rs 1.71 lakh crore in 2023 (debt AUC too expanded by 22.8 percent in 2023).
But the share of FPIs in equity AUC was down to 16.8 percent as of 31Dec2023 versus 17.1 percent a year ago. The share of FPIs in equity assets has been declining over the past two to three years gradually (19.9 percent as on 31Mar2021 vs 16.8 percent as of 31Dec2023).
Update 02Jan2024: Data as on 31Dec2023: After
two consecutive months of negative inflows in September and October, FPIs turned bullish and had
positive flows of Rs 9,000 crore in Nov2023 and Rs 66,100 crore in Dec2023. Meanwhile, India's main stock
indices, Sensex and Nifty 50 and mid-cap and small-cap indices are reaching new highs.
The December 2023 monthly inflow of Rs 66,135 crore by FPIs is the highest monthly inflow recorded in India's stock market history since FPIs started investing in Indian equities in 1992 (of course, because of Indian rupee's continued depreciation versus the US dollar and rising levels of Indian stock indices, the inflows of previous years cannot be strictly comparable to current numbers when the Sensex / Nifty 50 are at record highs and Indian rupee is at historical lows versus the US dollar).
The previous high for monthly FPI equity inflow was Rs 62,106 crore in Dec2020.
Overall in calendar year 2023, FPIs inflows in Indian stocks are Rs 171,100 crore -- which is the highest FPI equity inflow in a calendar year in recorded history. The previous high for calendar year FPI equity inflow was Rs 170,262 crore in 2020.
In 2023, the FPI inflows to debt segment are Rs 68,663 crore -- the highest in six years.
Total FPI inflows, including equity and debt segments, into India in 2023 are Rs 237,062 crore.
Update 02Dec2023: Data as on 30Nov2023: After two consecutive months of negative inflows, FPIs turned bullish and had positive flows of Rs 9,000 crore in Nov2023 even as India's main stock indices, Sensex and Nifty 50, are reaching new highs.
Update 10Nov2023: Data as on 31Oct2023: For the second month running FPI flows into Indian stocks were negative; during Oct2023, FPI outflows were Rs 24,548 crore. But the total flows in calendar year 2023 are positive at Rs 95,970 crore.
Tables 3 and 4 provide FPI flows (both for equity and debt) data for financial year-wise and calendar year-wise (data from 2010 to 2023):
Update 28Oct2023: Data as on 30Sep2023: as
on 30Sep2023, equity assets under custody (AUC) by FPIs increased by 17.3
percent in the past one year (between Sep2022 and Sep2023) in rupee terms to Rs 54.09 lakh crore.
Whereas in US dollar terms, equity AUC held by FPIs in the same period increased by 15.1 percent to USD 651.49 billion as the Indian rupee
depreciated by 1.8 percent versus the US dollar.
Though equity assets held by FPIs grew by 17.3 percent in the past year, the equity assets held by FPIs as a percentage of total BSE market capitalisation of all stocks remained the same at 17 percent. The growth of total BSE market cap is 17.4 percent in the past one year, while Nifty 50 grew by 13.3 percent and BSE 200 by 14.5 percent.
The share of FPIs in Indian stocks declined from 19.5 percent of total BSE market cap in Mar2017 to 17 percent in Sep2023.
It's significant to note the FPIs poured in Rs 167,869 crore in the past one year (end-Sep2022 to end-Sep2023) in Indian stocks.
Update 12Oct2023: FPI flows into Indian stocks turned negative in Sep2023, after being in positive zone for seven consecutive months between March and August 2023 -- but YTD (till 30Sep2023), total inflows are positive at Rs 120,500 crore. YTD, Sensex delivered a return of 8.2 percent.
Quarterly data of FPI flows is also available below.
Update 21Sep2023: Year-to-date (till 31Aug2023), FPI flows into Indian stock market are positive at Rs 135,000 crore with Sensex giving a return of 6.6 percent in the same period. For the sixth month consecutively, FPI flows have been positive with August inflows slowing at Rs 12,260 crore (however, in Sep2023 so far, FPI flows are negative).
Monthly data >
Update 02Aug2023: Year-to-date, FPI flows into Indian stock market are positive at Rs 123,000 crore with Sensex giving a return of 9.3 percent in the same period. For the fifth month consecutively, FPI flows have been positive, with July inflows at Rs 46,600 crore.
Monthly data >
Check quarterly data, including Apr-Jun2023 quarter, below >
Update 27Jul2023: Year-to-date, the FPI flows into Indian stocks are positive at Rs 76,400 crore. During May and June, Indian stock market attracted stronger FPI inflows.
Update 02May2023: Year-to-date, the FPI flows into Indian stocks are negative at Rs 14,600 crore, though March and April experienced positive flows. In the past 12 months (May2022 to Apr2023), the FPI flows were negative at Rs 8,850 crore.
Update 15Apr2023: Data as on 31Mar2022: as on 31Mar2022, equity assets under custody (AUC) by FPIs declined by 4.9 percent in the past one year in rupee terms to Rs 44.59 lakh crore. Whereas in US dollar terms, equity AUC held by FPIs in FY 2022-23 declined by 12.4 percent to USD 542.60 billion as the Indian rupee depreciated by 7.8 percent in FY 2022-23 versus the US dollar.
As on 31Mar2017, FPIs used to hold USD 365 billion in equity AUC, which has gone up to USD 543 billion as on 31Mar2023 -- showing a growth of 48 percent. But the share of FPIs' equity holdings as a percentage of total BSE market capitalisation has declined from 19.5 percent six years ago to 17.3 percent now.
In the past six years (from FY 2017-18 to FY 2022-23), net flows by FPIs to Indian equities were to the tune of Rs 182,147 crore -- while in financial years 2017-18 and 2020-21, there were net inflows, in the other four financial years, there were net outflows by FPIs into equities (details in image below updated on 04Apr2023).
Two images >
Update 04Apr2023: Out of the past five financial years (from 2018-19 to 2022-23), FPIs have net outflows in Indian stocks in four financial years (table 3 below) -- but the combined net inflow for five years is Rs 37,465 crore. In COVID-19 year (2020-21), Indian stock market had massive inflow of Rs 2.67 lakh crore from FPIs.
The following four images show data till 31Mar2023 pertaining to calendar year-wise, financial year-wise, quarter-wise and month-wise data >
Update 12Mar2023: From Jan2014 til 10Mar2023, FPI net inflows (cumulative) into Indian equity market are Rs 3.09 lakh crore; while total net inflows, including debt segment, are Rs 5.48 lakh crore.
From FY 2014-15 till 10Mar2023, FPI net inflows (cumulative) into Indian equity market are Rs 2.87 lakh crore; while total net inflows, including debt segment, are Rs 4.90 lakh crore.
Update 04Feb2023 : During the first month of 2023, FPIs sold Indian stocks worth Rs 28,852 crore reversing their positive stance during the last quarter of 2022.
FPI monthly data >
Update 31Jan2023 : FPI AUC data as on 31Dec2022 > two images below >
During 2022, FPI equity assets under custody decreased by 9.2 percent to USD 593 billion in USD terms; in rupee terms, FPI equity AUC decreased by just 0.5 percent to Rs 48.34 lakh crore. Over the years, the share of FPIs in Indian stocks has been coming down progressively and now their share is just 17.1 percent of total BSE market cap.
In the debt segment, the fall is higher with FPI debt AUC decreasing by 15.7 percent in 2022 in USD terms.
BSE market cap in 2022 increased by 6.2 percent, while BSE 200 index rose by 4.2 percent - the difference is due to listing of LIC of India, which is a big stock by market cap, in May 2022.
Update 07Jan2023 : During the 12-month period (between Dec2021 and Dec2022), FPIs net sold Indian stocks worth Rs 121,400 crore or nearly USD 15 billion, though there were net buyers to the extent of Rs 96,000 crore or nearly 11.8 billion in the second half of calendar year 2022.
If you see the quarterly data, you will find that in the first two quarters of 2022, FPIs sold Indian stocks heavily, though they were net buyers in the last two quarters of 2022.
However, over a medium period of past three years (between Dec2019 and Dec2022), FPIs were net buyers of just about Rs 75,000 crore of Indian stocks; while Sensex surged by almost 50 percent from 41,250 to 60,800 in the same period. So, all the talk of India is the cynosure of the foreign investors is just a narrative without any support from foreign investors (foreign direct investment or FDI is not considered here).
Please see two graphs below > one with monthly and another with quarterly data >
Update 02Dec2022: During the 9-month period (between Oct2021 and Jun2022), FPIs' outflows from Indian stocks were around Rs 256,000 crore; whereas Sensex lost 10.3 percent of its value in the same period (which is described as Indian market resilience to heavy FPI selling) -- but in the following 5-month period between Jul2022 and Nov2022, Sensex gained 19.0 percent (or 10,000 points) with FPIs' inflows at Rs 84,800 crore in the same period -- then why do experts see the resurgence in stocks in the past five months as driven by FPI inflows?
Image showing monthly data of FPI Flows (equity) from Jan2021 to Nov2022 >
Update 02Nov2022: Monthly data of FPI Flows (equity) > from Jan2021 to Oct2022 >
Update 17Oct2022: FPI AUC data as on 30Sep2022 > two images below >
Update 05Oct2022: Monthly and quarterly data of FPI Flows (equity) >
Update 03Sep2022: Monthly data of FPI Flows (equity) >
-------------------
Read more:
Nifty 50 Index Quarterly Movement
Mutual Fund Asset Class Returns 30Jun2022
Global Bond Yields and Asset Prices
Global Market Data 30Jun2022
Slowest Growth in India's Real Per Capita Income
Why is India Falling Behind Bangladesh?
Slowing Foreign Direct Investment to India
A Rundown on Prince Pipes & Fittings
When Will Foreign Investors Stop Selling Indian Stocks?
Indian Mutual Funds and The Art of Ripping Off Investors
Weblinks and Investing
-------------------
Disclosure: I've vested interested
in Indian stocks and other investments. It's safe to assume I've interest in the financial instruments / products discussed, if
any.
Disclaimer: The analysis and
opinion provided here are only for information purposes and should not be construed
as investment advice. Investors should consult their own financial advisers
before making any investments. The author is a CFA Charterholder with a vested
interest in financial markets.
CFA Charter credentials - CFA Member Profile
CFA Badge
He blogs at:
https://ramakrishnavadlamudi.blogspot.com/
https://www.scribd.com/vrk100
Twitter @vrk100