Saturday 31 December 2022

Mutual Funds Asset Class Returns 31Dec2022 - vrk100 - 31Dec2022

Mutual Funds Asset Class Returns 31Dec2022


(Update 01Apr2023  for this blog is available)


This is an update of an earlier blog published on 08Jul2022. Now, I present the data as at the end of 31st of December, 2022. The data contain select categories of mutual funds in India, numbering fifteen, from equity, debt and commodity (gold) categories.

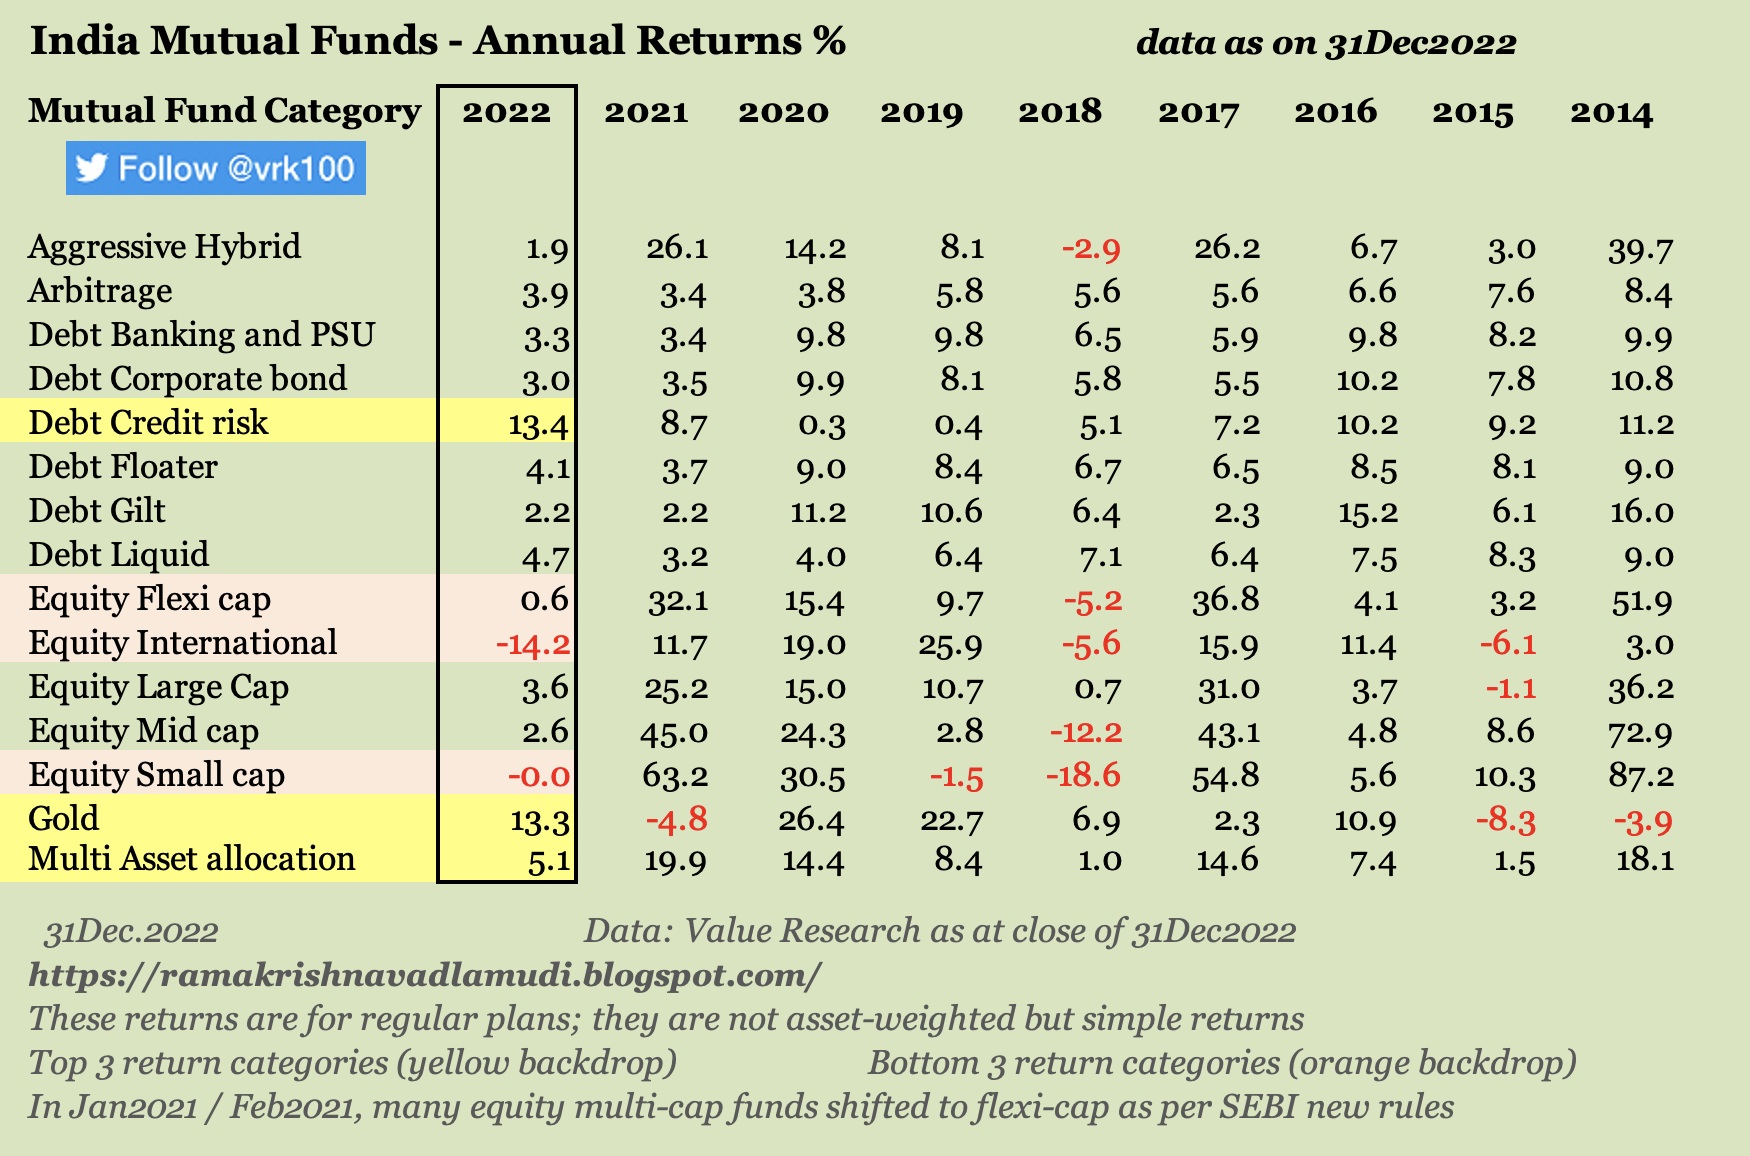
Table 1: Asset return matrix - annual returns (top to bottom returns in 2022) > 

Please click on the image to view better > 


What Table 1 reveals is:

  • asset class returns are cyclical in nature
  • in calendar year 2022, credit risk fund category (debt mutual funds) has delivered the highest return of 13.4 percent, followed by gold (13.3 percent) and multi-asset allocation funds (5.1 percent)
  • gold is the leitmotif for cyclical nature of asset class returns: it did better than other asset classes in 2016, 2019, 2020 and 2022; but did poorly in 2021, 2015 and 2014 -- in 2022, gold achieved decent returns of 13.3 percent
  • among equity, small cap funds did better than others in 2021, 2020 and 2014; but did poorly in 2019 and 2018
  • asset classes (or mutual fund categories) that did well in 2021 have given, in general, poor returns in 2022 
  • it is better to look at consistency of annual returns, along with latest trailing returns, rather than looking at just latest trailing returns--while comparing various mutual fund categories and plans
  • Liquid mutual funds used to provide decent returns (providing protection against inflation) till middle of 2019; but have been providing poor returns since the middle of 2019 -- though they started providing higher returns since the middle of 2022 as compared to prior periods
  • As returns are hard to predict, it's better to have a proper asset allocation according to one's risk appetite and personal situation in order to smooth out volatility of returns


(the blog continues below)

-------------------

Important information relating to SEBI categorization and rationalization of mutual fund plans introduced in 2017:

SEBI circular dated 06Oct2017

SEBI circular dated 04Dec2017

Tweet 15Apr2018

Tweet 26Jun2018

Several Tweets

-------------------


Table 2: Asset return matrix - trailing returns (10-year returns top to bottom)  > 

Please click on the image to view better > 


What Table 2 reveals is: 

  • Small-cap equity funds have provided best returns on a 10-year trailing returns basis, though they have provided no returns as a category in the past one year
  • on a 10-year trailing basis, equity mid-cap and flexi cap funds too have provided inflation-beating returns
  • Gold, arbitrage and credit risk funds have provided poor returns on a 10-year trailing basis
  • on a 3-year trailing basis, the returns of gilt funds, Banking and PSU funds and floater funds are a big disappointment for investors
  • though credit risk funds had delivered highest returns (among the 15 selected funds) in 2022, on a 10-year basis their returns are at the bottom of the pile


- - -

Additional data

The following tables provide asset return matrix for annual returns  and trailing returns -- the data are as provided in Tables 1 and 2 above, but in alphabetical order >


The following are screenshots from Value Research captured on 31Dec2022 >


-------------------

Read more:  

BSE Broad and Sector Indices Market Cap 31Dec2022

Global Market data 31Dec2022

BSE Broad and Sector Indices Returns 30Dec2022

Crisil Report - Big Shift in Financialisation 

Global bond yields, negative real interest rates and soft landing

Indian Energy Exchange Buyback Offer 2022 

Larsen & Toubro Infotech & Mindtree Merger Effective 14Nov2022

Indian Energy Exchange Limited - Brief Analysis

JP Morgan Guide to the Markets 

Infosys Limited Buyback Offer 2022

Indians' Love For Cash Continues Unabated

Exit India Policy by Foreign Investors

Nifty 50 Index Quarterly Movement

Weblinks and Investing

-------------------


Disclosure:  I've vested interested in Indian stocks and other investments. It's safe to assume I've interest in the financial instruments / products discussed, if any.

Disclaimer: The analysis and opinion provided here are only for information purposes and should not be construed as investment advice. Investors should consult their own financial advisers before making any investments. The author is a CFA Charterholder with a vested interest in financial markets. 

CFA Charter credentials  - CFA Member Profile

CFA Badge


He blogs at:

https://ramakrishnavadlamudi.blogspot.com/

https://www.scribd.com/vrk100

Twitter @vrk100

BSE Broad and Sector Indices Market Cap 31Dec2022 - vrk100 - 31Dec2022

BSE Broad and Sector Indices Market Cap 31Dec2022 


(update dated 01Jan2024 with data as on 31Dec2023 is available here)


This is an update of my earlier blog published on 04Apr2022. The following two tables show how the market capitalisations of broad and sector indices of BSE Limited have performed during the past one year, that is, between end-Dec2021 and end-Dec2022.


(write-up continues below)

------------------------

Related blogs:

 BSE Broad and Sector Indices Market Cap 31Mar2022

BSE Broad and Sector Indices Market Cap 31Dec2021

BSE Broad and Sector Indices Returns 31Dec2022


------------------------


Table 1: BSE Broad and Sector Indices' Market Cap as on 31Dec2022 - index representation - Index valuation measures (P/E, P/B ratios and dividend yield) > 

Please click on the table for a better view > 


As shown in above table, market capitalisation of all BSE companies as on 31Dec2022 is Rs 282.38 lakh crore and market cap-GDP ratio works out to 1.09 (India's nominal GDP for the latest available trailing 12-month period, Oct2021-Sep2022, is Rs 259.44 lakh crore).


The market cap of BSE 500 index represents 92.5 percent of total BSE market cap. Of the sectoral indices, BSE Financial Services (in 2022, BSE Finance was renamed as BSE Financial Services) is the biggest by market cap with a market cap of Rs 67.34 lakh crore, representing 23.8 percent of total market cap.


BSE Financial Services index is followed by BSE Consumer Discretionary, BSE Teck and BSE Commodities indices (BSE Basic Materials was renamed as BSE Commodities in 2022).


The valuation ratios of Indian stocks continues to be high. The Price-earnings or P/E ratio of Sensex is 23.7; its P/B ratio is 3.4; and its dividend yield is just 1.17 percent.


Table 2: BSE Broad and Sector Market caps - market cap change - Change during the past one year, that is, between end-Dec2021 and end-Dec2022

Please click on the table for a better view > 


As shown above, the total BSE market cap increased by 6.2 percent to Rs 282.38 lakh crore in 2022. The 6.2 percent increase is distorted by the fact that LIC of India stock was listed on Indian bourses in May 2022. The market cap of LIC stock is Rs 433,000 crore with a per share price of Rs 684 as at the end of 31Dec2022. 


It may be mentioned the number of stocks in BSE AllCap index rose from 1,086 in Dec2021 to 1,164 as at the end of Dec2022.


The market cap of BSE Mid cap index (122 stocks) rose by 15.5 percent while that of Sensex (30 stocks) went by up just 2.8 percent. 


The divergence between Sensex and BSE Midcap index is mainly due to increase in number of stocks in BSE Midcap index from 97 in Dec2021 to 122 in Dec2022; and another reason could be the spectacular returns delivered by some heavyweight stocks, like, Bharat Electronics, Varun Beverages, Tube Investments of India, Cholamandalam Investment & Finance, Trent and AU Small Finance Bank in Midcap index. 


Of the BSE Sector indices, the best performers in terms of percentage increase in market cap are: BSE Utilities, BSE Commodities, BSE Financial Services and BSE Capital goods indices. At the bottom of the pile are: BSE Info Tech, BSE Industrials and BSE Healthcare indices. The change in market cap can be gleaned from the above table.


- - -

-------------------

Read more:  

Global Market data 31Dec2022

BSE Broad and Sector Indices Returns 30Dec2022

Crisil Report - Big Shift in Financialisation 

Global bond yields, negative real interest rates and soft landing

Indian Energy Exchange Buyback Offer 2022 

Larsen & Toubro Infotech & Mindtree Merger Effective 14Nov2022

Indian Energy Exchange Limited - Brief Analysis

JP Morgan Guide to the Markets 

Infosys Limited Buyback Offer 2022

Indians' Love For Cash Continues Unabated

Exit India Policy by Foreign Investors

Nifty 50 Index Quarterly Movement

Mutual Fund Asset Class Returns

Global Bond Yields and Asset Prices

Weblinks and Investing

-------------------


Disclosure:  I've vested interested in Indian stocks and other investments. It's safe to assume I've interest in the financial instruments / products discussed, if any.

Disclaimer: The analysis and opinion provided here are only for information purposes and should not be construed as investment advice. Investors should consult their own financial advisers before making any investments. The author is a CFA Charterholder with a vested interest in financial markets. 

CFA Charter credentials  - CFA Member Profile

CFA Badge


He blogs at:

https://ramakrishnavadlamudi.blogspot.com/

https://www.scribd.com/vrk100

Twitter @vrk100

Global Market Data 31Dec2022 - vrk100 - 31Dec2022

Global Market Data 31Dec2022 


(please look at the blog dated 16Jan2023  for data from 2012 to 2022)


Quarter-to-date global market data, as on 30 December 2022, of stocks, bonds, currencies and commodities is as follows: 

Table 1: (please click on the image to view better) 


Between 30Sep2022 and 31Dec2022, global stock markets seems to have stabilised with Dow Jones, S&P 500, FTSE 100 and Hang Seng recovering significantly compared to the first nine months of calendar year 2022. 


With Japanese Yen, Euro and Pound Sterling bouncing back spectacularly, versus the US dollar, the US dollar index lost 7.7 percent in the fourth quarter (Q4). Crypto currencies (crypto assets) continue their losing streak in Q4 with Bitcoin losing its price by up to 15 percent. 


Silver gained massively in Q4 returning 27 percent whereas gold gained 9.7 percent. The US 10-year Treasury yield gained just 5 basis points (100 basis points equal one percentage point) in Q4 though it had fallen from its peak of 4.30 percent attained in the fourth week of October 2022.


Year-to-date (past 12-month returns) global market data as on 30Dec2022 are presented below:

Table 2: (please click on the image to view better)


The US stocks in calendar year 2022 have witnessed their worst yearly performance since the global financial crisis (GFC) in 2008. Nasdaq is the worst performing major index with a loss of 33 percent -- with bellwether stocks, like, Apple, Facebook, Tesla, Amazon and Google (Alphabet) losing heavily. 


Sovereign bond yields of major countries have surged in 2022, giving bondholders their worst performance in several decades. The 10-year US Treasury yield gained 237 basis points in 2022, while India 10-year government bond yield gained 88 basis points in the same period. 


One notable feature of 2022 is both the US stocks and bonds have shown pathetic performance in the same year, with the traditional 60-40 stocks-bond portfolio (60 percent stocks and 40 percent bonds) giving the worst performance in several decades.


Indian stocks have significantly outperformed their global peers with Sensex gaining 4.4 percent in 2022. Though pound sterling lost more than 10 percent of its value versus the US dollar in 2022 and the UK government bond prices facing tumultuous times, FTSE 100 index is stable in 2022 with a gain of one percent. 


With Europe bearing the brunt of Russia's invasion of Ukraine and the concomitant  energy crisis, DAX 30 index lost 12 percent in 2022. 


Crypto currencies are the worst performing 'asset class' in 2022 with Bitcoin losing almost two-thirds of its value.  The US dollar gained 9 percent and 11 percent against the Chinese Yuan and Indian rupee respectively in 2022. 


Looking forward to 2023, one is hoping global markets may stabilise even as recessionary fears in the US and Europe have been increasing. But one should brace for heightened volatility in financial markets especially in the first half of 2023. 

- - -


P.S.: In Table 2 above, the change in US 10-year Treasury yield was wrongly mentioned as up 137 basis points, which was actually up 237 bp -- the same was corrected on 17Jan2023.
 

-------------------

Read more:  

BSE Broad and Sector Indices Returns 30Dec2022

Crisil Report - Big Shift in Financialisation 

Global bond yields, negative real interest rates and soft landing

Indian Energy Exchange Buyback Offer 2022 

Larsen & Toubro Infotech & Mindtree Merger Effective 14Nov2022

Indian Energy Exchange Limited - Brief Analysis

JP Morgan Guide to the Markets 

Infosys Limited Buyback Offer 2022

Indians' Love For Cash Continues Unabated

Exit India Policy by Foreign Investors

Nifty 50 Index Quarterly Movement

Mutual Fund Asset Class Returns

Global Bond Yields and Asset Prices

Weblinks and Investing

-------------------


Disclosure:  I've vested interested in Indian stocks and other investments. It's safe to assume I've interest in the financial instruments / products discussed, if any.

Disclaimer: The analysis and opinion provided here are only for information purposes and should not be construed as investment advice. Investors should consult their own financial advisers before making any investments. The author is a CFA Charterholder with a vested interest in financial markets. 

CFA Charter credentials  - CFA Member Profile

CFA Badge


He blogs at:

https://ramakrishnavadlamudi.blogspot.com/

https://www.scribd.com/vrk100

Twitter @vrk100


Friday 30 December 2022

BSE Broad and Sector Indices Returns 30Dec2022 - vrk100 - 30Dec2022

BSE Broad and Sector Indices Returns 30Dec2022 


(update dated 01Jan2024 with data as on 31Dec2023 is available here)


This is an update of an earlier blog published on 04Apr2022. The data here show how the broad and sector indices of BSE Limited have performed on an annual and trailing basis as at the end of 30Dec2022 (which is the last trading day of 2022).


------------------------

Related blogs:

BSE Broad and Sector Indices Market Cap 31Dec2022

BSE Broad and Sector Indices Market Cap 31Mar2022

BSE Broad and Sector Indices Market Cap 31Dec2021

------------------------ 


Table 1: Trailing Returns - BSE Indices - year-to-date (YTD) to 10-year returns 30Dec2022

Please click on the table for a better view > 


As shown in the above table, BSE Sensex has delivered a CAGR or compounded annual growth rate of 12.1 percent in the past ten years, whereas the Dollex 30 index delivered a CAGR of just 7.6 percent, due to the depreciation of Indian rupee versus the US dollar. 


Dollex 30 index is nothing but Sensex expressed in US dollar terms. The biggest gainers in 2022 are BSE Power, PSU, Bankex, FMCG and Auto indices; while the worst performers are BSE IPO, Info Tech and Healthcare indices. 


The top gainers of 2022 in Sensex are ITC, Mahindra & Mahindra and IndusInd Bank while the top losers are Wipro Ltd, Tech Mahindra and Infosys.


Table 2: Annual Returns - BSE Indices - 2014 to 2022 - 30Dec2022

Please click on the table for a better view > 

 
The cyclical nature of sectors and broad indices can be observed from the above table 2. BSE mid- and small-cap indices did well in 2021 and 2020, but they practically delivered no returns in 2022. Whereas BSE Info Tech index delivered spectacular returns in 2021 and 2020 but it was a nasty disappointment for investors. BSE IPO index too was crushed in 2022 though it did well prior to 2022.

 
Table 3: BSE AllCap Index and its sector representation


Indian indices are dominated by finance, info tech, Oil & Gas, FMCG (consumer goods) and transport stocks. These five sectors have got almost two-thirds share in the BSE AllCap index as at the end of December 2022, as shown above.

- - -


Additional Data:

BSE Broad Indices values as on 30Dec2022 > 


BSE Sectoral Indices values as on 30Dec2022 > 


 Value Research Indian annual returns and trailing returns as on 30Dec2022 > 


-------------------

Read more:  

Crisil Report - Big Shift in Financialisation 

Global bond yields, negative real interest rates and soft landing

Indian Energy Exchange Buyback Offer 2022 

Larsen & Toubro Infotech & Mindtree Merger Effective 14Nov2022

Indian Energy Exchange Limited - Brief Analysis

JP Morgan Guide to the Markets 

Infosys Limited Buyback Offer 2022

Global Market Data 30Sep2022

JP Morgan Guide to the Markets

Indians' Love For Cash Continues Unabated

Exit India Policy by Foreign Investors

Nifty 50 Index Quarterly Movement

Mutual Fund Asset Class Returns

Global Bond Yields and Asset Prices

Slowest Growth in India's Real Per Capita Income

Weblinks and Investing

-------------------


Disclosure:  I've vested interested in Indian stocks and other investments. It's safe to assume I've interest in the financial instruments / products discussed, if any.

Disclaimer: The analysis and opinion provided here are only for information purposes and should not be construed as investment advice. Investors should consult their own financial advisers before making any investments. The author is a CFA Charterholder with a vested interest in financial markets. 

CFA Charter credentials  - CFA Member Profile

CFA Badge


He blogs at:

https://ramakrishnavadlamudi.blogspot.com/

https://www.scribd.com/vrk100

Twitter @vrk100