JP Morgan Guide to the Markets Aug2021
JP Morgan Asset Management publishes a comprehensive presentation every month end, containing various slides on global markets, especially those relating to the US markets.
This is a very useful and informative guide for financial market professionals or FMPs. This "JP Morgan Guide to the Markets" can be accessed here. The following are some of the highlights presented in this guide: all the data are at the end of 31Aug2021:
1) S&P 500 index at inflection points: this contain the index level and the forward PE ratios at important inflection points in the past two decades:

2)S&P 500 valuation measures: contains 25-year average forward PE ratio, Shiller PE ratio, P/B, standard deviation and other ratios:

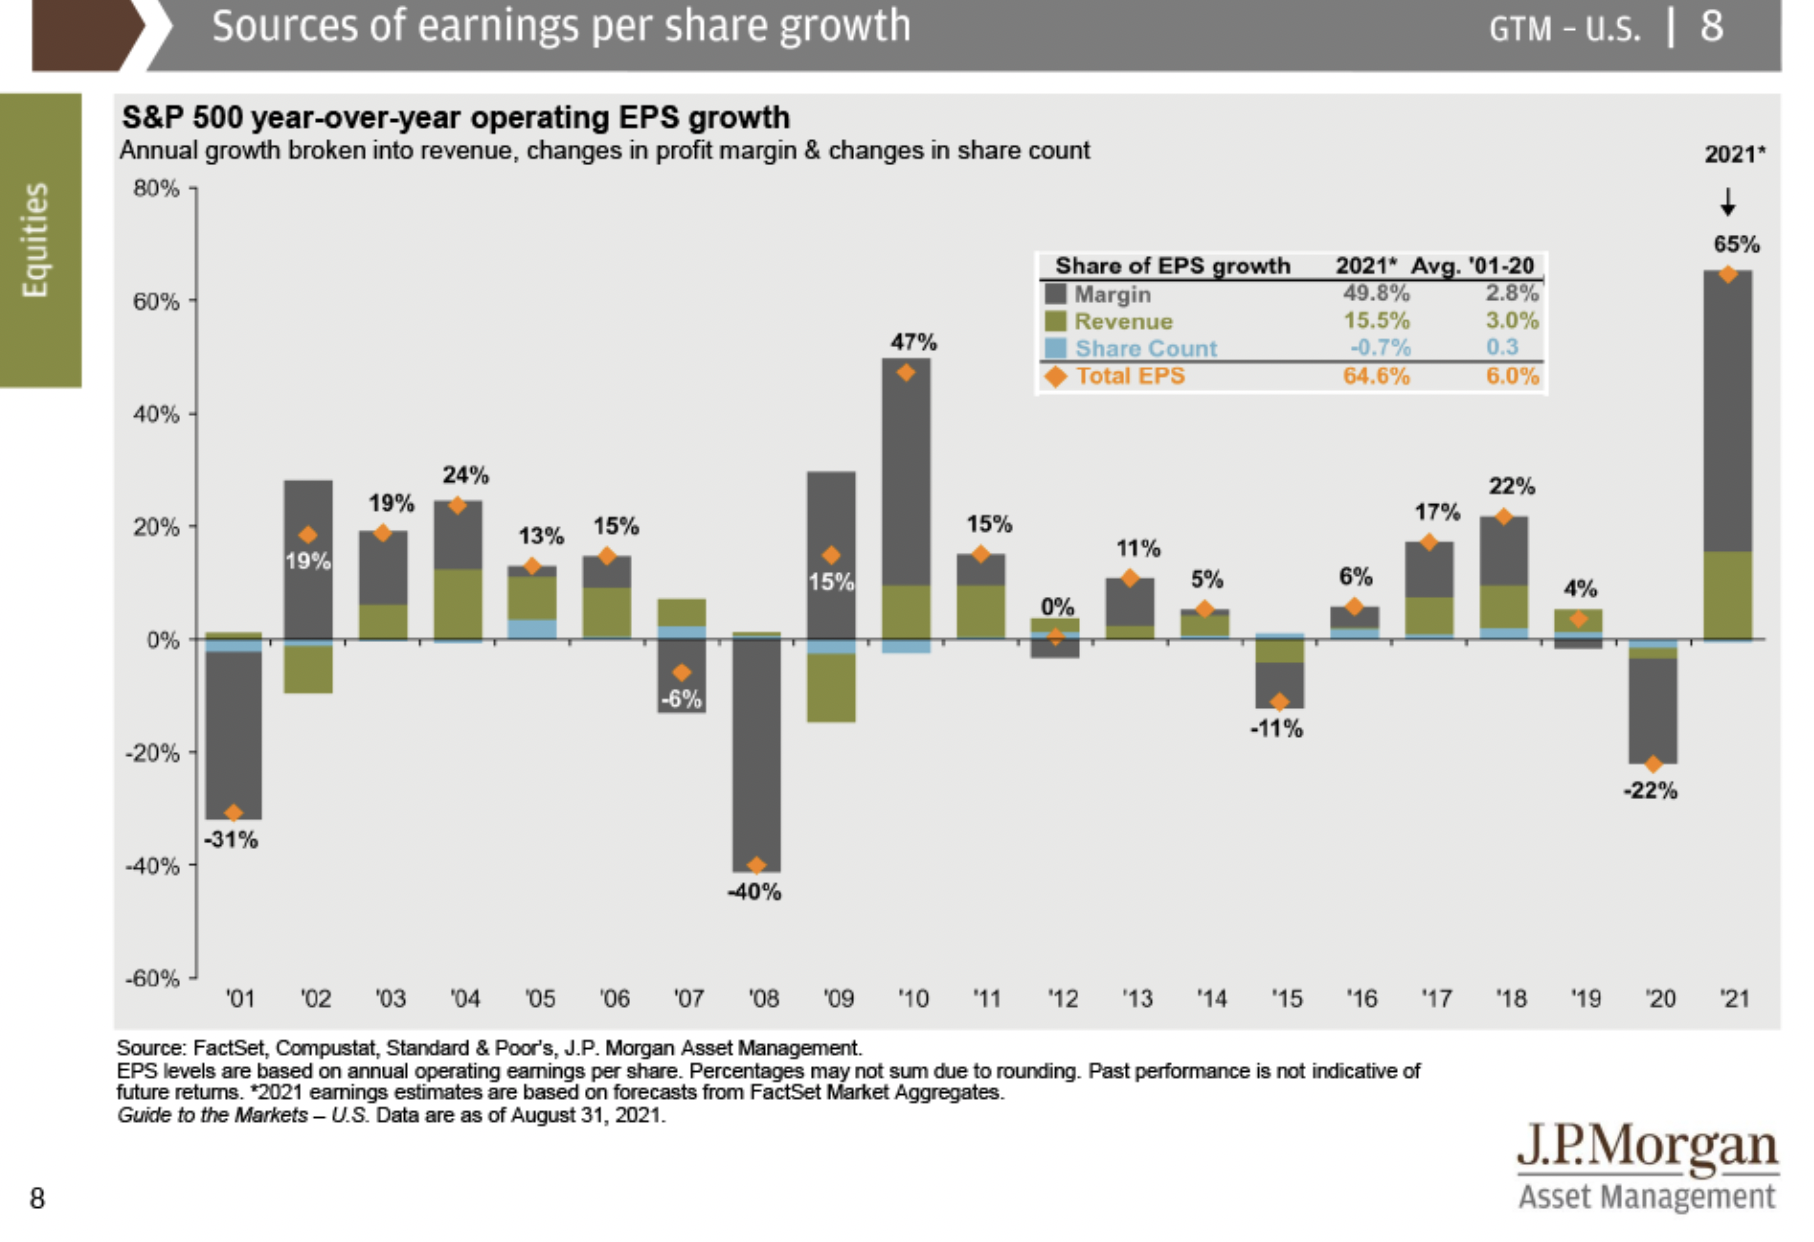
3) Sources of EPS growth of S&P 500: annual growth broken into revenue, changes in profit margin and share count:
4) Value vs growth relative valuations: S&P 500 sector correlations to real US GDP: Industrials have high correlation, while consumer staples, utilities, consumer discretionary and healthcare have very low correlation:

5) S&P 500 index concentration: PE ratio of Top 10 and the rest; weight of top 10 stocks and earnings contribution of top 10 stocks:

6) Factor performance: return matrix: returns of small-cap, large-cap, value, growth, defensive, cyclical, momentum, quality, etc:

7) S&P 500 intra-year declines vs calendar year returns:

8) Interest rates and equities: in the US, stocks and rates move in tandem until 10-year yield rises to 3.6% and then they move in opposite direction:

9) US stock market since 1900: S&P 500 composite index at several events, like, New Deal, WWII, Vietnam War, Reagan Era, Tech Boom, GFC, etc; and during recession periods:

10) Components of US GDP: 69% consumption, 17.7% govt consumption, 12.6% investment ex-housing, 4.7% housing and - 3.9% exports:

11) Income inequality in the US: Top 10% of pre-tax income reaches the highest level of 50.5% now:

12) Long-time drivers of US economic growth: In the last decade (2011-2020), the real GDP growth is driven by productivity or growth in real output per worker (1%) and growth in workers (0.7%):

- - -
P.S.: The following sources of information / images are added (all data as of 31Aug2021 for items 13 to 23 also), as additional information, after the above article was published on 17Sep2021:
13) High-frequency economic activity: high-frequency economic indicators like, mortgage applications, consumer transactions, hotel occupancy, travel and navigation app usage, seated diners and TSA traveler traffic.

14) Unemployment and wages: 50-year average unemployment rate is 6.3 per cent and 50-year average wage growth is 4.0 per cent.

15) Employment and income by educational attainment:

16) 50-year average inflation (headline CPI) in the US is 3.9 per cent.
17) The US dollar drivers are US trade balance (current account deficit) and developed markets' interest rate (10-year bond yields) differentials.

18) Oil markets: US, OPEC and Russia output; global consumption and crude oil prices.

19) The Fed balance sheet expansion (QE1, QE2, QE3 and QE4):

20) Interest rates and inflation: Real 10-year US Treasury yield is the nominal 10-year yield minus year-over-year core CPI inflation. Real yield as on 31Aug2021 is minus 2.93 (1.30 - 4.23) per cent.
21) Global equity markets: Year-to-date (01Jan2021 to 31Aug2021), Indian stock market outperformed major stock markets. YTD, India delivered 26.1 per cent vs S&P 500 21.6 per cent.

22) Asset class returns (asset return matrix):

23) Diversification and the average investor: Of all asset class returns, returns earned by average investors are among the bottom.

UPDATE for Nov2021 JP Morgan Guide to the Markets
References:
JP Morgan Guide to the Markets 30Jun2021 PDF
Tweet thread dated 05Jun2021 - charts of old dates
Tweet thread dated 17Jan2021 - asset class returns / return matrix
Disclosure: I've vested interested in Indian stocks and other investments. It's safe to assume I've interest in the financial products discussed, if any.
Disclaimer: The analysis and opinion provided here are only for information purposes and should not be construed as investment advice. Investors should consult their own financial advisers before making any investments. The author is a CFA Charterholder with a vested interest in financial markets.
CFA Charter credentials - CFA Member Profile
CFA Badge
He blogs at:
https://ramakrishnavadlamudi.blogspot.com/
Twitter @vrk100
No comments:
Post a Comment