Friday, 17 September 2021

JP Morgan Guide to the Markets Aug2021 - vrk100 - 17Sep2021

JP Morgan Guide to the Markets Aug2021  

JP Morgan Asset Management publishes a comprehensive presentation every month end, containing various slides on global markets, especially those relating to the US markets.

This is a very useful and informative guide for financial market professionals or FMPs.  This "JP Morgan Guide to the Markets" can be accessed here. The following are some of the highlights presented in this guide: all the data are at the end of 31Aug2021:

1) S&P 500 index at inflection points: this contain the index level and the forward PE ratios at important inflection points in the past two decades:


2)S&P 500 valuation measures: contains 25-year average forward PE ratio, Shiller PE ratio, P/B, standard deviation and other ratios:


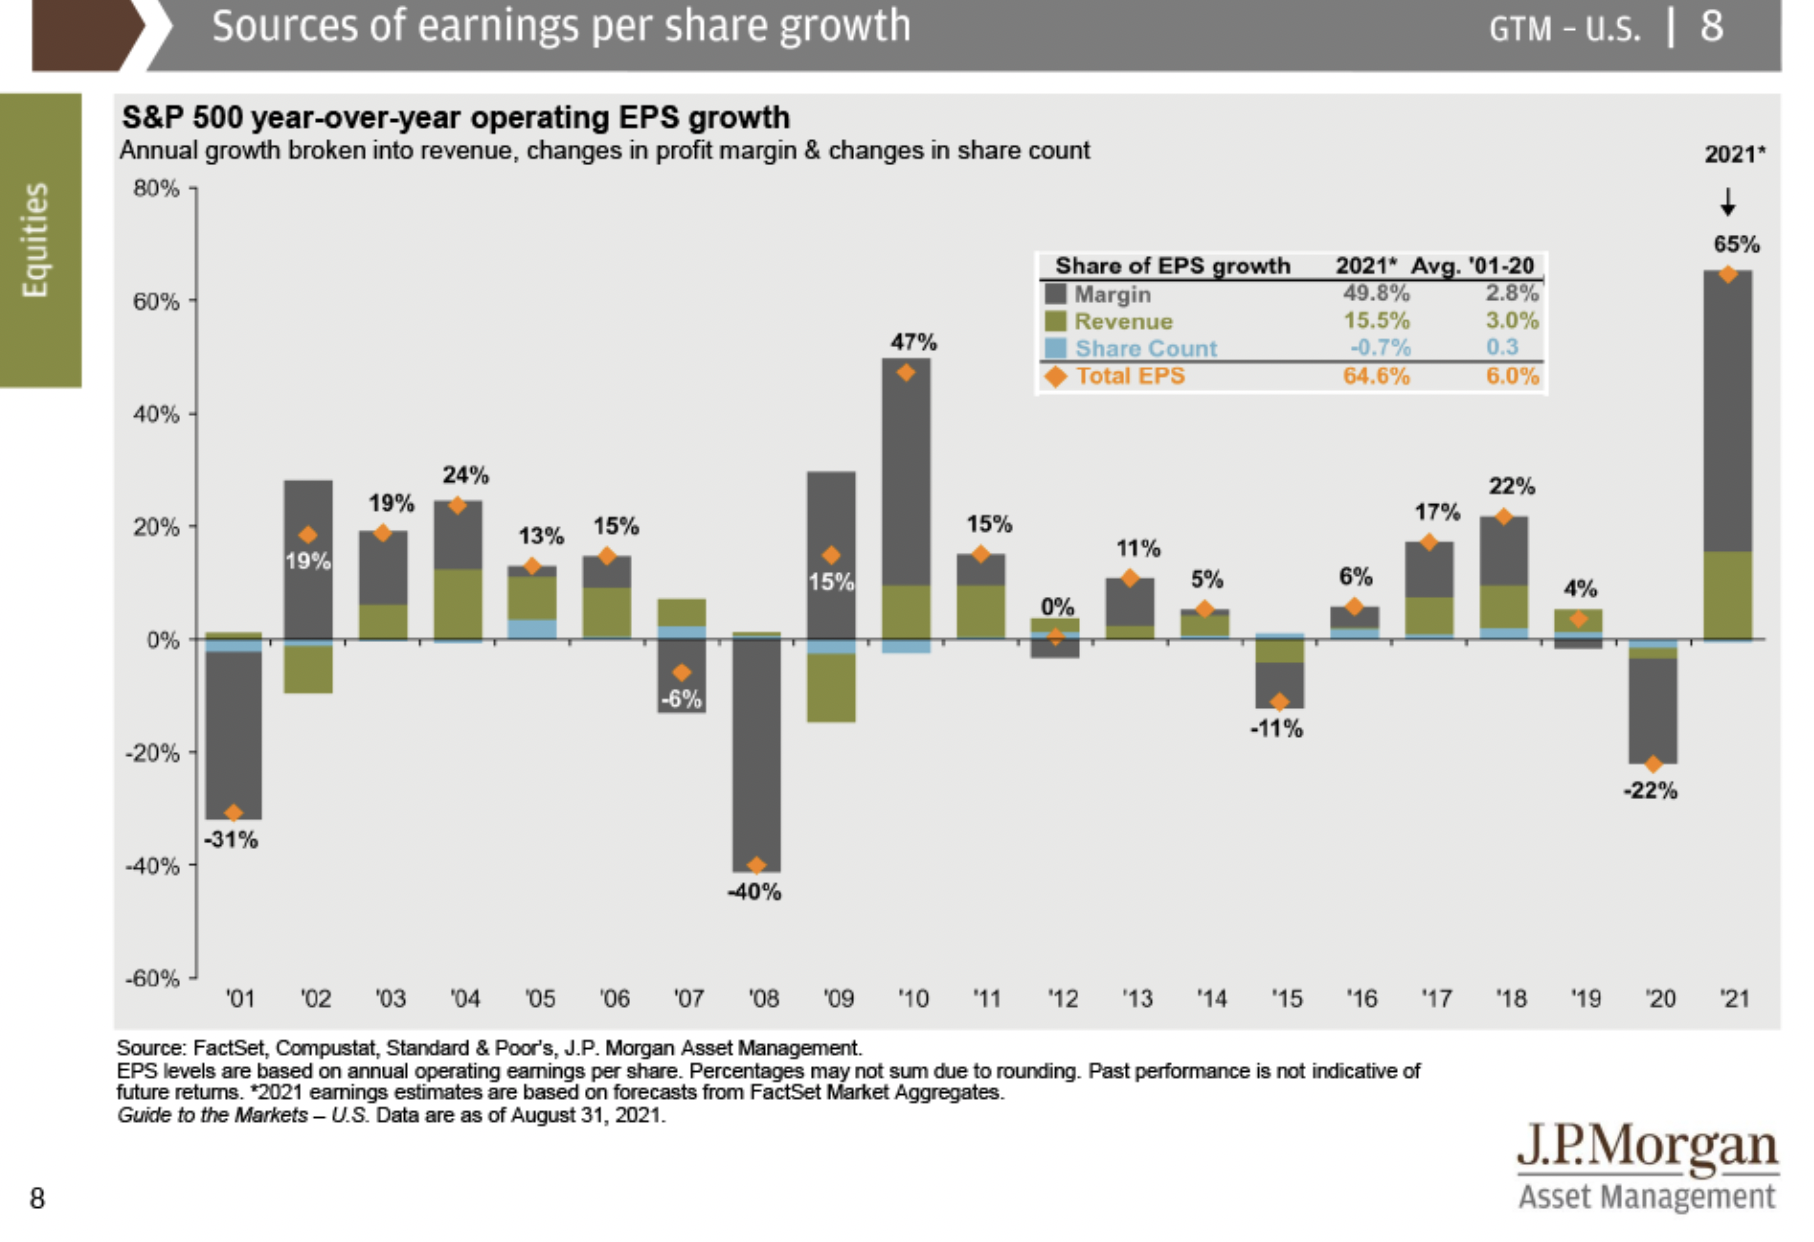
3) Sources of EPS growth of S&P 500: annual growth broken into revenue, changes in profit margin and share count:
 

4) Value vs growth relative valuations: S&P 500 sector correlations to real US GDP: Industrials have high correlation, while consumer staples, utilities, consumer discretionary and healthcare have very low correlation:


5) S&P 500 index concentration: PE ratio of Top 10 and the rest; weight of top 10 stocks and earnings contribution of top 10 stocks:


6) Factor performance: return matrix: returns of small-cap, large-cap, value, growth, defensive, cyclical, momentum, quality, etc:


7) S&P 500 intra-year declines vs calendar year returns:


8) Interest rates and equities: in the US, stocks and rates move in tandem until 10-year yield rises to 3.6% and then they move in opposite direction:


9) US stock market since 1900: S&P 500 composite index at several events, like, New Deal, WWII, Vietnam War, Reagan Era, Tech Boom, GFC, etc; and during recession periods:


10) Components of US GDP: 69% consumption, 17.7% govt consumption, 12.6% investment ex-housing, 4.7% housing and - 3.9% exports:


11) Income inequality in the US: Top 10% of pre-tax income reaches the highest level of 50.5% now:


12) Long-time drivers of US economic growth: In the last decade (2011-2020), the real GDP growth is driven by productivity or growth in real output per worker (1%) and growth in workers (0.7%):


- - - 


P.S.: The following sources of information / images are added (all data as of 31Aug2021 for items 13 to 23 also), as additional information, after the above article was published on 17Sep2021:

 
13) High-frequency economic activity: high-frequency economic indicators like, mortgage applications, consumer transactions, hotel occupancy, travel and navigation app usage, seated diners and TSA traveler traffic.


14) Unemployment and wages: 50-year average unemployment rate is 6.3 per cent and 50-year average wage growth is 4.0 per cent.

15) Employment and income by educational attainment:

16) 50-year average inflation (headline CPI) in the US is 3.9 per cent.

17) The US dollar drivers are US trade balance (current account deficit) and developed markets' interest rate (10-year bond yields) differentials.


18) Oil markets: US, OPEC and Russia output; global consumption and crude oil prices.

19) The Fed balance sheet expansion (QE1, QE2, QE3 and QE4):

20) Interest rates and inflation: Real 10-year US Treasury yield is the nominal 10-year yield minus year-over-year core CPI inflation. Real yield as on 31Aug2021 is minus 2.93 (1.30 - 4.23) per cent.

21) Global equity markets: Year-to-date (01Jan2021 to 31Aug2021), Indian stock market outperformed major stock markets. YTD, India delivered 26.1 per cent vs S&P 500 21.6 per cent.


22) Asset class returns (asset return matrix):


23) Diversification and the average investor: Of all asset class returns, returns earned by average investors are among the bottom.

UPDATE for Nov2021 JP Morgan Guide to the Markets

References:

JP Morgan Guide to the Markets 30Jun2021 PDF

Tweet thread dated 05Jun2021 - charts of old dates

Tweet thread dated 17Jan2021 - asset class returns / return matrix

Disclosure:  I've vested interested in Indian stocks and other investments. It's safe to assume I've interest in the financial products discussed, if any.

Disclaimer: The analysis and opinion provided here are only for information purposes and should not be construed as investment advice. Investors should consult their own financial advisers before making any investments. The author is a CFA Charterholder with a vested interest in financial markets. 

CFA Charter credentials  - CFA Member Profile

CFA Badge


He blogs at:

https://ramakrishnavadlamudi.blogspot.com/

https://www.scribd.com/vrk100

Twitter @vrk100 


Sunday, 12 September 2021

When Will Federal Reserve Raise Interest Rates? - vrk100 - 12Sep2021

When Will Federal Reserve Raise Interest Rates?  


(please check Updated blog 25Feb2023)


Since February of 2021, financial markets have been expecting a rise in US interest rates. In reaction to this, the US 10-year Treasury yield rose from 1.20 per cent to 1.75 per cent by March 2021, before cooling off to 1.34 per cent by last Friday (see graph below).

For the past two months, the US Federal Reserve has been hinting at tapering of its bond purchases, without giving any definitive timeline to the tapering. The Fed has also hinted at raising interest rates by the end of 2022 or by start of 2023.

Past Rate Hike Cycles

Since 1999, there were three rising rate cycles from the US Federal Reserve:

First: Fed Chair Alan Greenspan started raising federal funds rate from 4.75 per cent in Jun1999 to 6.50 per cent in May2000 (175 basis points increase in 11 months). The first rising rate cycle coincided with the DotCom Bubble.

----------------------

Read more:  

Fed Tapering is Postponed

Why is US inflation low? 04Oct2013

Decoding the US Government Shutdown 27Sep2013

Why did US Fed raise discount rate? 20Feb2010

US Fed rate cut and its impact on financial markets 17Dec2008

----------------------

Second: Greenspan started raising fed funds rate from 1.00 per cent in Jun2004; followed by Bernanke till 5.25 per cent in Jun2006 (425 bp increase in 24 months). The second cycle coincided partially with booming stock markets globally.

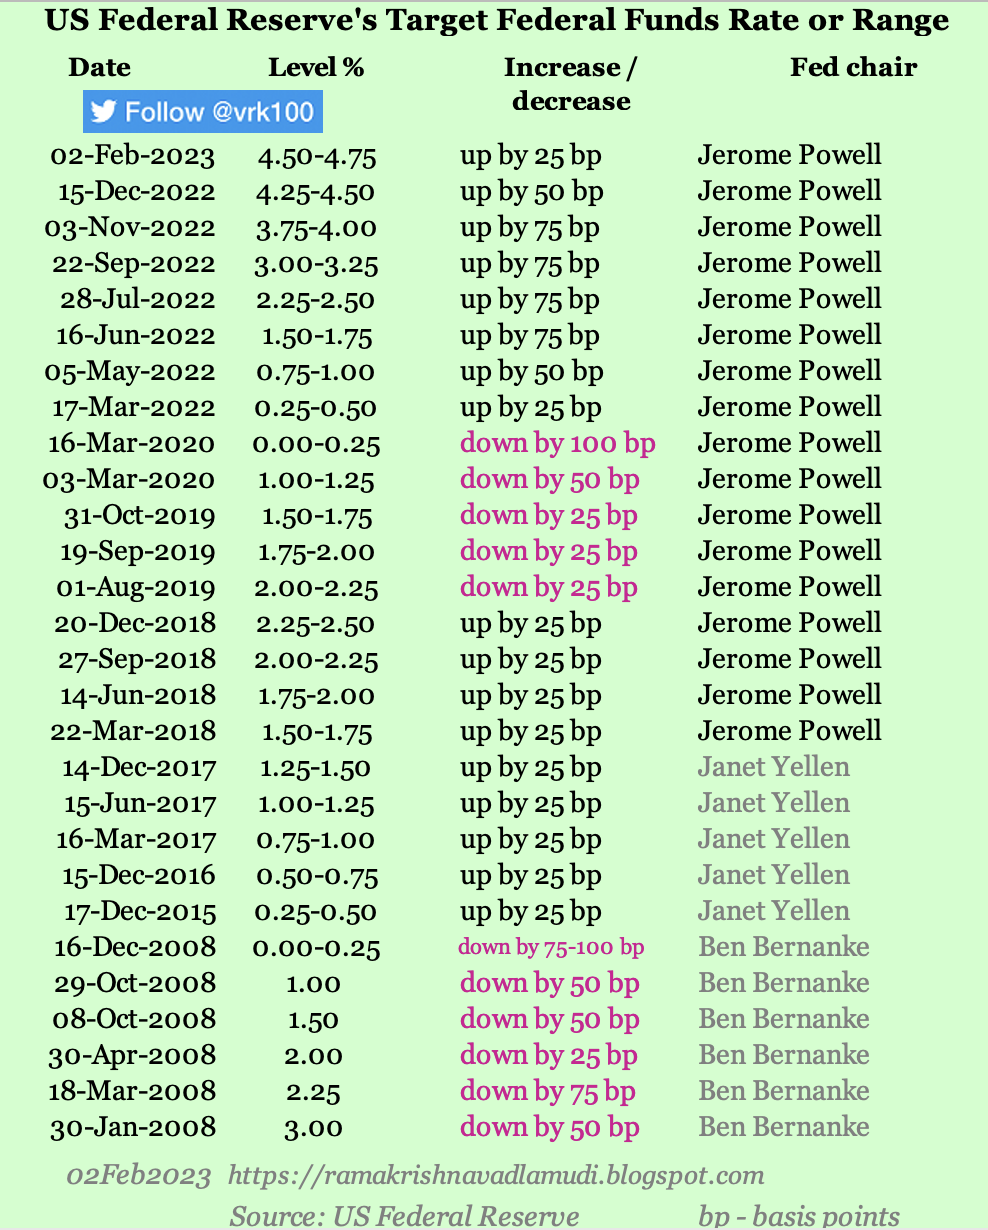
Third: Fed chair Janet Yellen started hiking fed funds rate from 0.00-0.25 per cent range in Dec2015; followed by Jerome Powell till 2.25-2.50 per cent range in Dec2018 (up by 225 bp in 36 months). For seven years between Dec2008 and Dec2015, Fed funds rate remained steady at nearly zero bound (that is, 0.00-0.25 per cent) without a single change.

You can check the images below for a detailed timeline of Federal Funds rate (fed rate) revisions. 

Economic indicators

The US CPI (consumer price inflation) is above two per cent since March of this year. For the month of July 2021, its print is at 5.4 per cent (graph below), the highest since July 2008.

PCE or personal consumption expenditure inflation, a measure closely tracked by the Fed, is 4.20 per cent for July 2021. 

The US unemployment rate is 5.2 per cent for August 2021. It fell from all-time high level of 14.8 per cent reached in April 2020. 

The unemployment rate needs to be interpreted in the context of falling labor force participation rate since 2000. The labor force participation rate is 61.7 per cent for August 2021. It fell from a high level of 67.3 per cent attained in January 2000 (graph below).

Non-farm payroll employment rose by 235,000 in August 2021, much below the Bloomberg survey of 725,000. 

Many experts have been criticizing the Fed for not initiating the bond tapering even though many economic indicators have been showing signs of good recovery.

The data, however, indicate that there is still considerable slack in the US labor market. Given the levels of unemployment rate, labor force participation rate, PCE inflation, high levels of commodity prices, and other indicators, the Fed may start tapering its bond purchases by the start of 2022.

But when it comes to interest rate rise, what the Fed will do I've no clue. The future interest rate trajectory depends on incoming data. My guess is the next rate cycle may start somewhere in 2023.

 Graph 1 - CPI inflation rate:

 
Graph 2 - US 10-year Treasury yield:


Graph 3 and 4 - US Fed Funds rate revisions from Jan2006 till now:


Graph 5 - US labor force participation rate:


 - - -
 
 
P.S.: The Federal Open Market Committee (FOMC) at its meeting on 01Feb2023 decided to raise federal funds rate by 25 basis points to 4.50-4.75 per cent > 


P.S.: The Federal Open Market Committee (FOMC) at its meeting on 14Dec2022 decided to raise federal funds rate by 50 basis points to 4.25-4.50 per cent > 


P.S.: The Federal Open Market Committee (FOMC) at its meeting on 02Nov2022 decided to raise federal funds rate by 75 basis points to 3.75-4.00 per cent > 


P.S.: The Federal Open Market Committee (FOMC) at its meeting on 21Sep2022 decided to raise federal funds rate by 75 basis points to 3.00-3.25 per cent > 


P.S.: The Federal Open Market Committee (FOMC) in its meeting on 27Jul2022 decided to raise federal funds rate by 75 basis points to 2.25-2.50 per cent >


P.S.: The Federal Open Market Committee (FOMC) in its meeting on 15Jun2022 decided to raise federal funds rate by 75 basis points to 1.50-1.75 per cent > 

 
P.S.: The Federal Open Market Committee (FOMC) in its meeting on 04May2022 decided to raise federal funds rate by 50 basis points to 0.75-1.00 per cent > 


P.S.: The Federal Open Market Committee (FOMC) in its meeting on 16Mar2022 decided to raise federal funds rate by 25 basis points to 0.25-0.50 per cent >


References:

Fed funds rate - historical; FOMC open market operations

Fred data - US unemployment rate 

Fred data - US unemployment level

Fred data - US labor force participation rate 

Fred data - US 10-year treasury yield Fred data - US CPI inflation rate (edit it with option 'percent change from year ago') 

US CPI inflation rate historical 1914 till now

Fred data - US PCE inflation rate (edit it with option 'percent change from year ago') 

Fred data - US PCE inflation rate and Core PCE inflation
 
NY Fed data - US economy in a snapshot - PDF for Sep2021 

- - -

Disclosure:  I've vested interested in Indian stocks and other investments. It's safe to assume I've interest in the financial products discussed, if any.

Disclaimer: The analysis and opinion provided here are only for information purposes and should not be construed as investment advice. Investors should consult their own financial advisers before making any investments. The author is a CFA Charterholder with a vested interest in financial markets. 

CFA Charter credentials  - CFA Member Profile

CFA Badge


He blogs at:

https://ramakrishnavadlamudi.blogspot.com/

https://www.scribd.com/vrk100

Twitter @vrk100

Thursday, 2 September 2021

India First Quarter GDP Growth of FY 2021-22 - vrk100 - 02Sep2021

India First Quarter GDP Growth of FY 2021-22 


A few days ago, Indian government announced GDP (gross domestic product or annual income) estimates for the first quarter of financial year 2021-22. The real GDP (at constant prices) for the first quarter is Rs 32.38 lakh crore, showing a growth of 20.1 per cent as compared to the first quarter of FY 2020-21.

It may be noted that the real GDP in Q1 of FY 2020-21 contracted by 24.4 per cent due to severe lockdown imposed by the Modi government after the COVID-19 outbreak. 

Table 1 - Real GDP (click on the image for a better view):


As shown in the table 1 above, the first quarter GDP for FY 2021-22 is still below the real GDP number of Rs 35.67 lakh crore in Q1 of FY 2019-20.

The COVID-19 pandemic has severely hit services sector during the Apr-Jun 2021 quarter also, though agriculture and manufacturing sectors have done reasonably.

Table 2 - GDP at current prices (click on the image for a better view): 


As shown in table 2 above, the first quarter GDP for FY 2021-22 at current prices is Rs 51.23 lakh crore, showing a growth of 31.7 per cent versus the first quarter of FY 2020-21.

It is expected the economic recovery will continue for the next two quarters with expectations of a 9 to 10 per cent real GDP growth for the fully year of 2021-22.

Note: India's financial year starts from April to March of every year.

Reference: MOSPI press note dated 31Aug2021


- - -

Disclosure:  I've vested interested in Indian stocks and other investments. It's safe to assume I've interest in the financial products discussed, if any.

Disclaimer: The analysis and opinion provided here are only for information purposes and should not be construed as investment advice. Investors should consult their own financial advisers before making any investments. The author is a CFA Charterholder with a vested interest in financial markets. 

CFA Charter credentials  - CFA Member Profile

CFA Badge


He blogs at:

https://ramakrishnavadlamudi.blogspot.com/

https://www.scribd.com/vrk100

Twitter @vrk100